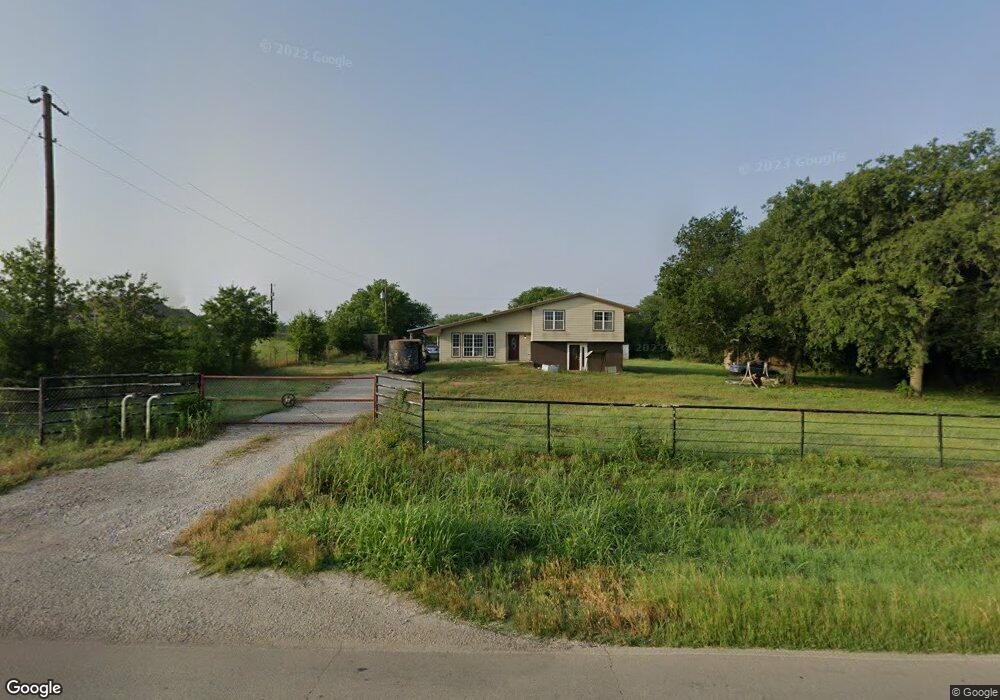
6850 Veal Station Rd Weatherford, TX 76085
Estimated Value: $336,911 - $480,000
--
Bed
--
Bath
1,728
Sq Ft
$242/Sq Ft
Est. Value
About This Home
This home is located at 6850 Veal Station Rd, Weatherford, TX 76085 and is currently estimated at $417,978, approximately $241 per square foot. 6850 Veal Station Rd is a home located in Parker County with nearby schools including Silver Creek Elementary School, Azle Elementary School, and Azle Junior High School.
Ownership History
Date
Name
Owned For
Owner Type
Purchase Details
Closed on
Mar 10, 2018
Sold by
Miller Mary
Bought by
Kck Legacy Trust
Current Estimated Value
Purchase Details
Closed on
Aug 14, 2017
Sold by
Thompson Mike C
Bought by
Eldridge Kenneth
Purchase Details
Closed on
Nov 19, 2010
Sold by
Welcher David and Welcher Cheryl
Bought by
Gore Suzanne
Home Financials for this Owner
Home Financials are based on the most recent Mortgage that was taken out on this home.
Original Mortgage
$58,400
Interest Rate
4.27%
Mortgage Type
Seller Take Back
Purchase Details
Closed on
May 24, 1993
Bought by
Eldridge Kenneth J
Purchase Details
Closed on
Oct 6, 1992
Bought by
Eldridge Kenneth J
Purchase Details
Closed on
Jul 31, 1980
Bought by
Eldridge Kenneth J
Create a Home Valuation Report for This Property
The Home Valuation Report is an in-depth analysis detailing your home's value as well as a comparison with similar homes in the area
Home Values in the Area
Average Home Value in this Area
Purchase History
| Date | Buyer | Sale Price | Title Company |
|---|---|---|---|
| Kck Legacy Trust | -- | None Available | |
| Eldridge Kenneth | $2,525 | None Available | |
| Gore Suzanne | -- | Fnt | |
| Eldridge Kenneth J | -- | -- | |
| Eldridge Kenneth J | -- | -- | |
| Eldridge Kenneth J | -- | -- |
Source: Public Records
Mortgage History
| Date | Status | Borrower | Loan Amount |
|---|---|---|---|
| Previous Owner | Gore Suzanne | $58,400 |
Source: Public Records
Tax History Compared to Growth
Tax History
| Year | Tax Paid | Tax Assessment Tax Assessment Total Assessment is a certain percentage of the fair market value that is determined by local assessors to be the total taxable value of land and additions on the property. | Land | Improvement |
|---|---|---|---|---|
| 2025 | $960 | $177,858 | -- | -- |
| 2024 | $960 | $161,689 | -- | -- |
| 2023 | $960 | $146,990 | $0 | $0 |
| 2022 | $2,473 | $173,480 | $40,990 | $132,490 |
| 2021 | $2,355 | $173,480 | $40,990 | $132,490 |
| 2020 | $2,130 | $110,440 | $24,000 | $86,440 |
| 2019 | $2,111 | $110,440 | $24,000 | $86,440 |
| 2018 | $1,925 | $113,230 | $24,000 | $89,230 |
| 2017 | $1,668 | $113,230 | $24,000 | $89,230 |
| 2016 | $1,516 | $77,600 | $10,000 | $67,600 |
| 2015 | $560 | $77,600 | $10,000 | $67,600 |
| 2014 | $1,662 | $85,330 | $10,000 | $75,330 |
Source: Public Records
Map
Nearby Homes
- 100 Oak Meadow Ln
- 313 Oak Meadow Ln
- The Greyson II Plan at Vintage Oaks
- The Wellington II Plan at Vintage Oaks
- The Hunter Plan at Vintage Oaks
- The Aylin Plan at Vintage Oaks
- The Braden II Plan at Vintage Oaks
- The Ryder Plan at Vintage Oaks
- The Braden Plan at Vintage Oaks
- The Harper II Plan at Vintage Oaks
- 201 Oak Meadow Ln
- 233 Oak Meadow Ln
- 300 Oak Meadow Ln
- 629 Bent Tree Ln
- 1390 Mary Dr
- 6550 Veal Station Rd
- 7081 Veal Station Rd
- 7220 Tucker Dr
- 105 Ash Ln
- The Wilder Plan at Brooks Meadow
- 6820 Veal Station Rd
- 6855 Veal Station Rd
- 6894 Veal Station Rd
- 6891 Veal Station Rd
- 115 Mary Dr
- 6897 Veal Station Rd
- 18 Finney Dr
- 123 Finney Dr
- 130 Finney Rd
- 0 Finney Dr
- 6809 Veal Station Rd
- 6900 Veal Station Rd
- 151 Dove Haven Ln
- 120 Finney Dr
- 6901 Veal Station Rd
- 131 Dove Haven Ln
- 6799 Veal Station Rd
- 6905 Veal Station Rd
- 6950 Veal Station Rd
- 6902 Veal Station Rd