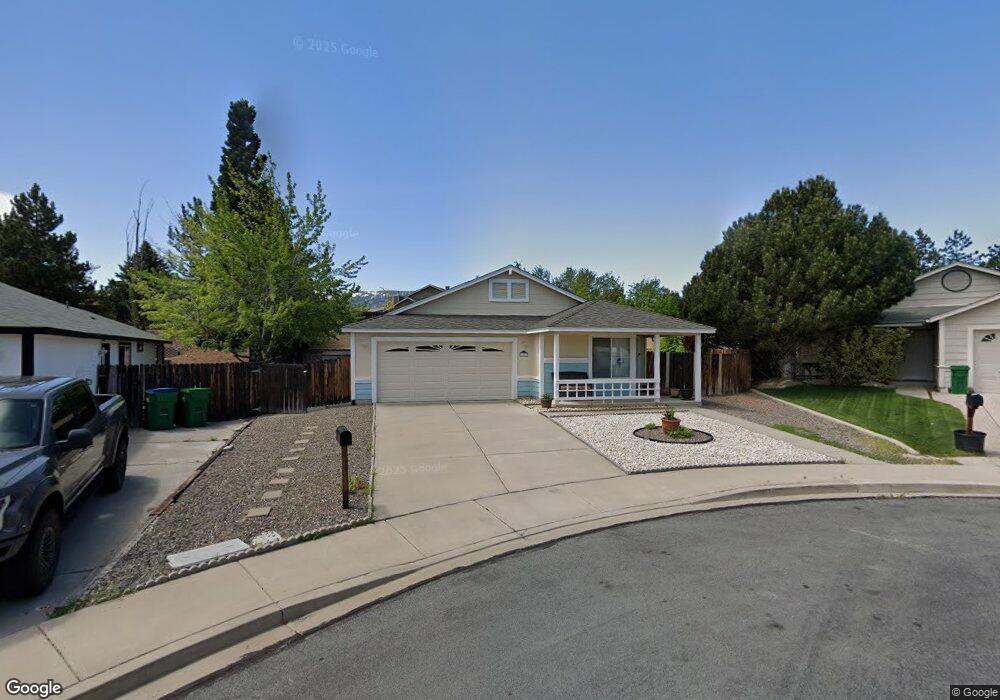
6850 Viscaya Ct Reno, NV 89523
Northgate NeighborhoodEstimated Value: $538,000 - $550,000
3
Beds
2
Baths
1,270
Sq Ft
$428/Sq Ft
Est. Value
About This Home
This home is located at 6850 Viscaya Ct, Reno, NV 89523 and is currently estimated at $544,060, approximately $428 per square foot. 6850 Viscaya Ct is a home located in Washoe County with nearby schools including B D Billinghurst Middle School, Robert McQueen High School, and Riverview Christian Academy.
Ownership History
Date
Name
Owned For
Owner Type
Purchase Details
Closed on
Mar 11, 2024
Sold by
Rice Connie
Bought by
Connie Rice Living Trust and Rice
Current Estimated Value
Home Financials for this Owner
Home Financials are based on the most recent Mortgage that was taken out on this home.
Original Mortgage
$99,500
Outstanding Balance
$97,845
Interest Rate
6.63%
Mortgage Type
New Conventional
Estimated Equity
$446,215
Purchase Details
Closed on
Dec 3, 2020
Sold by
Rice Connie S
Bought by
Rice Connie and The Connie Rice Living Trust
Purchase Details
Closed on
Apr 22, 2019
Sold by
Johnson John Leroy and Johnson Karen Elizabeth
Bought by
Rice Connie S
Purchase Details
Closed on
Jun 20, 2006
Sold by
Sumida Sylvia E
Bought by
Johnston John Leroy and Johnston Karen Elizabeth
Purchase Details
Closed on
Sep 27, 1996
Sold by
Bailey and Bailey Mcgah
Bought by
Sumida Sylvia E
Home Financials for this Owner
Home Financials are based on the most recent Mortgage that was taken out on this home.
Original Mortgage
$122,450
Interest Rate
7.87%
Create a Home Valuation Report for This Property
The Home Valuation Report is an in-depth analysis detailing your home's value as well as a comparison with similar homes in the area
Home Values in the Area
Average Home Value in this Area
Purchase History
| Date | Buyer | Sale Price | Title Company |
|---|---|---|---|
| Connie Rice Living Trust | -- | Stewart Title | |
| Rice Connie | -- | Stewart Title | |
| Rice Connie | -- | None Available | |
| Rice Connie S | $174,229 | None Available | |
| Johnston John Leroy | $318,000 | Stewart Title Of Northern Nv | |
| Sumida Sylvia E | $136,500 | Stewart Title |
Source: Public Records
Mortgage History
| Date | Status | Borrower | Loan Amount |
|---|---|---|---|
| Open | Rice Connie | $99,500 | |
| Previous Owner | Sumida Sylvia E | $122,450 |
Source: Public Records
Tax History Compared to Growth
Tax History
| Year | Tax Paid | Tax Assessment Tax Assessment Total Assessment is a certain percentage of the fair market value that is determined by local assessors to be the total taxable value of land and additions on the property. | Land | Improvement |
|---|---|---|---|---|
| 2025 | $2,255 | $86,043 | $36,645 | $49,398 |
| 2024 | $2,255 | $81,260 | $31,360 | $49,900 |
| 2023 | $2,190 | $83,063 | $35,700 | $47,363 |
| 2022 | $2,127 | $68,717 | $29,050 | $39,667 |
| 2021 | $2,067 | $63,601 | $24,010 | $39,591 |
| 2020 | $2,005 | $62,533 | $22,750 | $39,783 |
| 2019 | $1,981 | $60,980 | $22,400 | $38,580 |
| 2018 | $1,890 | $54,618 | $16,765 | $37,853 |
| 2017 | $1,814 | $53,656 | $15,645 | $38,011 |
| 2016 | $1,769 | $52,092 | $13,265 | $38,827 |
| 2015 | $1,766 | $50,812 | $11,900 | $38,912 |
| 2014 | $1,712 | $46,960 | $9,310 | $37,650 |
| 2013 | -- | $45,196 | $8,015 | $37,181 |
Source: Public Records
Map
Nearby Homes
- 1055 Udowski Unit Homesite 53
- 1025 Udowski Unit Homesite 56
- 0 Unit 250003854
- 6673 Enchanted Valley Dr
- 1410 Crosswater Dr
- 6811 Sonterra Ln
- 1585 Springfield Park Dr Unit 16G
- 1751 Glen Oaks Dr
- 1664 Shadow Wood Rd
- 7150 Crosswater Ct
- 1750 Polo Park Dr
- 1836 Cambridge Hills Ct
- 6440 Enchanted Valley Dr
- 1651 Ashbury Ln
- 6339 Park Place
- 6357 Moon Ridge Terrace
- 2014 Cradle Mountain Dr Unit 2
- 6850 Sharlands Ave Unit T 2113
- 6850 Sharlands Ave Unit Q1095
- 6850 Sharlands Ave Unit 1111
- 6840 Viscaya Ct
- 6860 Viscaya Ct
- 1430 Plainview Ct
- 1440 Plainview Ct
- 6830 Viscaya Ct
- 6870 Viscaya Ct
- 1420 Plainview Ct
- 1492 Calusa Ln
- 6820 Viscaya Ct
- 1502 Calusa Ln
- 1431 Plainview Ct
- 1471 Clovis Ct
- 1545 Mescalero Ave
- 1462 Calusa Ln
- 1535 Mescalero Ave
- 1512 Calus Ln
- 1555 Mescalero Ave
- 1410 Plainview Ct
- 1481 Clovis Ct