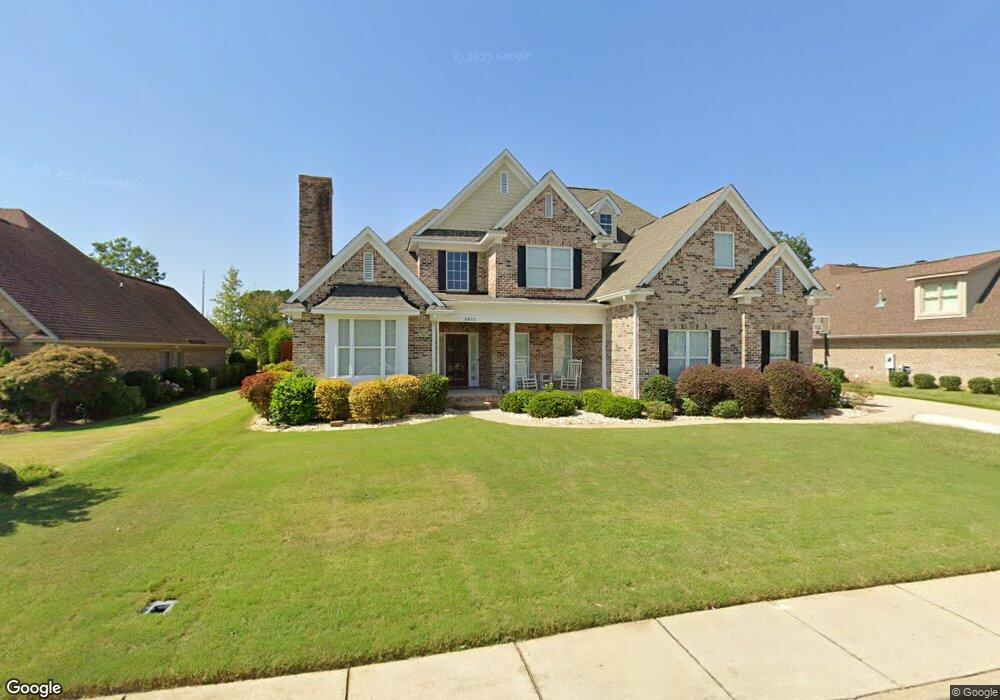
6853 Riverbrook Trace Columbus, GA 31904
North Columbus NeighborhoodEstimated Value: $437,160 - $474,000
5
Beds
5
Baths
2,788
Sq Ft
$164/Sq Ft
Est. Value
About This Home
This home is located at 6853 Riverbrook Trace, Columbus, GA 31904 and is currently estimated at $456,290, approximately $163 per square foot. 6853 Riverbrook Trace is a home with nearby schools including Double Churches Elementary School, Double Churches Middle School, and Northside High School.
Ownership History
Date
Name
Owned For
Owner Type
Purchase Details
Closed on
Sep 27, 2016
Sold by
Hinson Deidre H
Bought by
Williams Jeanette T and Williams Joseph D
Current Estimated Value
Home Financials for this Owner
Home Financials are based on the most recent Mortgage that was taken out on this home.
Original Mortgage
$2,965,000
Outstanding Balance
$2,377,003
Interest Rate
3.46%
Mortgage Type
VA
Estimated Equity
-$1,920,713
Purchase Details
Closed on
Jun 2, 2014
Sold by
Mckee Christopher P
Bought by
Hinson Deidre H
Home Financials for this Owner
Home Financials are based on the most recent Mortgage that was taken out on this home.
Original Mortgage
$281,879
Interest Rate
4.12%
Mortgage Type
FHA
Purchase Details
Closed on
May 5, 2011
Sold by
Southern Custom Constructi
Bought by
Mckee Pamela M and Mckee Christopher P
Home Financials for this Owner
Home Financials are based on the most recent Mortgage that was taken out on this home.
Original Mortgage
$230,000
Interest Rate
4.85%
Mortgage Type
New Conventional
Create a Home Valuation Report for This Property
The Home Valuation Report is an in-depth analysis detailing your home's value as well as a comparison with similar homes in the area
Home Values in the Area
Average Home Value in this Area
Purchase History
| Date | Buyer | Sale Price | Title Company |
|---|---|---|---|
| Williams Jeanette T | $296,500 | -- | |
| Hinson Deidre H | $293,000 | -- | |
| Mckee Pamela M | $315,000 | -- |
Source: Public Records
Mortgage History
| Date | Status | Borrower | Loan Amount |
|---|---|---|---|
| Open | Williams Jeanette T | $2,965,000 | |
| Previous Owner | Hinson Deidre H | $281,879 | |
| Previous Owner | Mckee Pamela M | $230,000 |
Source: Public Records
Tax History
| Year | Tax Paid | Tax Assessment Tax Assessment Total Assessment is a certain percentage of the fair market value that is determined by local assessors to be the total taxable value of land and additions on the property. | Land | Improvement |
|---|---|---|---|---|
| 2025 | $748 | $191,728 | $22,808 | $168,920 |
| 2024 | $106 | $162,800 | $22,808 | $139,992 |
| 2023 | $8 | $162,800 | $22,808 | $139,992 |
| 2022 | $734 | $132,696 | $22,808 | $109,888 |
| 2021 | $633 | $116,392 | $22,808 | $93,584 |
| 2020 | $1,063 | $116,392 | $22,808 | $93,584 |
| 2019 | $1,260 | $116,392 | $22,808 | $93,584 |
| 2018 | $1,447 | $116,392 | $22,808 | $93,584 |
| 2017 | $4,784 | $116,392 | $22,808 | $93,584 |
| 2016 | $4,287 | $117,200 | $23,200 | $94,000 |
| 2015 | $4,293 | $117,200 | $23,200 | $94,000 |
| 2014 | $4,662 | $126,000 | $23,200 | $102,800 |
| 2013 | -- | $126,000 | $23,200 | $102,800 |
Source: Public Records
Map
Nearby Homes
- 6801 River Rd Unit 406
- 6801 River Rd Unit 407
- 7015 Spring Walk Dr
- 280 Zachary Ct
- 6861 Copper Oaks Ct
- 268 Woodstream Dr
- 312 Woodstream Dr
- 308 Woodstream Dr
- 264 Woodstream Dr
- 6390 Cape Cod Dr
- 6400 Green Island Dr Unit 42
- 6400 Green Island Dr Unit 11
- 6400 Green Island Dr Unit 43
- 16 Kylemore Ct
- 6333 Cape Cod Dr
- 7309 Kirkwood Dr
- 6101 River Rd Unit 14
- 6101 River Rd Unit 13
- 6101 River Rd Unit 2
- 6101 River Rd Unit 5
- 6859 Riverbrook Trace
- 6847 Riverbrook Trace
- 168 Pebblebrook Ln
- 6841 Riverbrook Trace
- 6901 Riverbrook Trace
- 6824 Riverbrook Trace
- 169 Pebblebrook Ln
- 174 Pebblebrook Ln
- 6835 Riverbrook Trace
- 6818 Riverbrook Trace
- 6905 Riverbrook Trace
- 175 Pebblebrook Ln
- 182 Pebblebrook Ln
- 6885 Shadybrook Trail
- 6827 Riverbrook Trace
- 234 Clearbrook Ln
- 181 Pebblebrook Ln
- 238 Clearbrook Ln
- 6806 Riverbrook Trace
- 6873 Shadybrook Trail
Your Personal Tour Guide
Ask me questions while you tour the home.