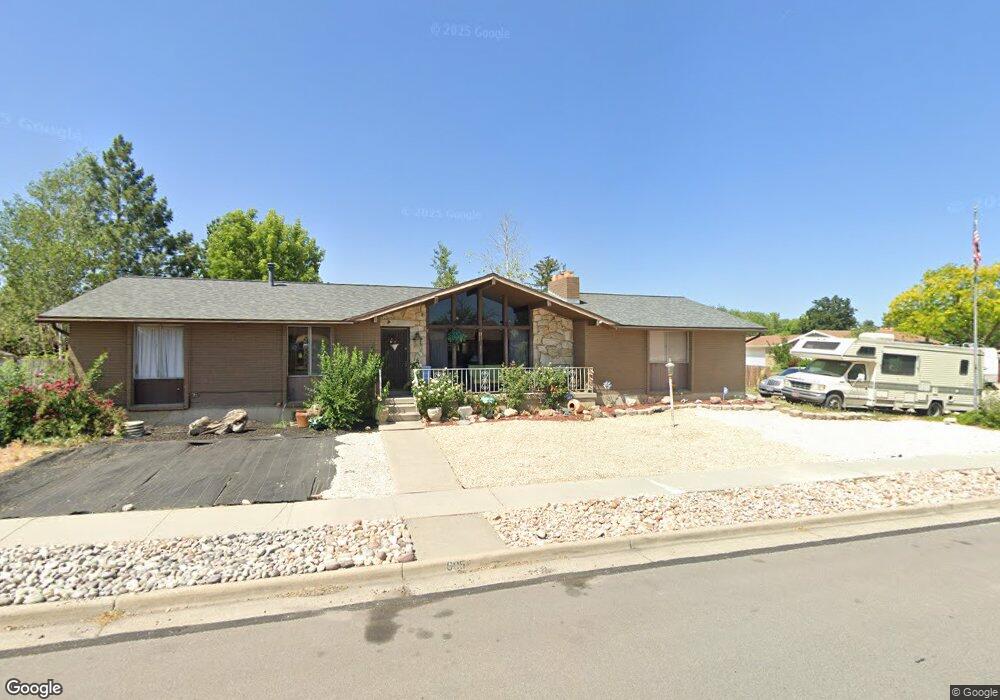
6854 Clover Cir West Jordan, UT 84084
Estimated Value: $532,000 - $569,000
3
Beds
3
Baths
2,606
Sq Ft
$209/Sq Ft
Est. Value
About This Home
This home is located at 6854 Clover Cir, West Jordan, UT 84084 and is currently estimated at $545,010, approximately $209 per square foot. 6854 Clover Cir is a home located in Salt Lake County with nearby schools including West Jordan School, Majestic Elementary Arts Academy, and West Jordan Middle School.
Ownership History
Date
Name
Owned For
Owner Type
Purchase Details
Closed on
Apr 6, 2023
Sold by
Michael Glen Pearson and Michael Virgina Lee
Bought by
Virginia L Pearson Revocable Living Trust
Current Estimated Value
Purchase Details
Closed on
Dec 16, 2009
Sold by
Pearson Michael G and Pearson Virginia L
Bought by
Pearson Michael Glen and Pearson Virginia Lee
Home Financials for this Owner
Home Financials are based on the most recent Mortgage that was taken out on this home.
Original Mortgage
$325,500
Interest Rate
4.88%
Mortgage Type
Reverse Mortgage Home Equity Conversion Mortgage
Purchase Details
Closed on
May 11, 2001
Sold by
Nypower Hellen
Bought by
Pearson Michael G and Pearson Virgina L
Home Financials for this Owner
Home Financials are based on the most recent Mortgage that was taken out on this home.
Original Mortgage
$137,837
Interest Rate
6.89%
Mortgage Type
FHA
Create a Home Valuation Report for This Property
The Home Valuation Report is an in-depth analysis detailing your home's value as well as a comparison with similar homes in the area
Home Values in the Area
Average Home Value in this Area
Purchase History
| Date | Buyer | Sale Price | Title Company |
|---|---|---|---|
| Virginia L Pearson Revocable Living Trust | -- | None Listed On Document | |
| Pearson Michael Glen | -- | Cottonwood Title | |
| Pearson Michael G | -- | Equity Title |
Source: Public Records
Mortgage History
| Date | Status | Borrower | Loan Amount |
|---|---|---|---|
| Previous Owner | Pearson Michael Glen | $325,500 | |
| Previous Owner | Pearson Michael G | $137,837 |
Source: Public Records
Tax History Compared to Growth
Tax History
| Year | Tax Paid | Tax Assessment Tax Assessment Total Assessment is a certain percentage of the fair market value that is determined by local assessors to be the total taxable value of land and additions on the property. | Land | Improvement |
|---|---|---|---|---|
| 2025 | $603 | $511,300 | $126,200 | $385,100 |
| 2024 | $603 | $495,900 | $122,000 | $373,900 |
| 2023 | $196 | $460,500 | $117,300 | $343,200 |
| 2022 | $422 | $471,800 | $115,000 | $356,800 |
| 2021 | $153 | $361,800 | $91,000 | $270,800 |
| 2020 | $2,083 | $317,500 | $85,000 | $232,500 |
| 2019 | $244 | $314,900 | $85,000 | $229,900 |
| 2018 | $138 | $276,600 | $80,300 | $196,300 |
| 2017 | $51 | $255,800 | $80,300 | $175,500 |
| 2016 | -- | $233,500 | $80,300 | $153,200 |
| 2015 | -- | $233,800 | $81,900 | $151,900 |
| 2014 | $18 | $220,400 | $78,000 | $142,400 |
Source: Public Records
Map
Nearby Homes
- 6918 S Harvest Cir
- 2683 W Carson Ln
- 2421 W 6900 S
- 8524 S Michele River Ave W Unit 109
- 2312 W Hidden Bend Cove Unit 107
- 6924 S 2160 W
- 6893 S 3200 W
- 6512 Timpanogos Way
- 2333 W Ledgewood Dr
- 7361 S 2700 W
- 2332 Broderick Dr
- 6453 Fremont Peak Cir
- 6925 S Lexington Dr
- 3052 W Matterhorn Dr
- 6672 S 3335 W
- 2510 W Jordan Meadows Ln
- 3383 W 6880 S
- 2573 Jordan Meadows Ln
- 3226 Tysonbrook Ct
- 1951 W 7125 S
- 2680 W 6865 S
- 6844 Clover Cir
- 2675 W 6865 S
- 6839 S 2700 W
- 6834 Clover Cir
- 6853 Clover Cir
- 2685 W 6865 S
- 2715 W 6865 S Unit 28
- 6843 Clover Cir
- 6843 S Clover Cir
- 6829 S 2700 W
- 6888 Harvest Cir
- 6888 S Harvest Cir
- 6877 Harvest Cir
- 6833 Clover Cir
- 6891 S 2700 W
- 6819 S 2700 W
- 6887 Harvest Cir
- 6824 Clover Cir
- 2590 W 6865 S