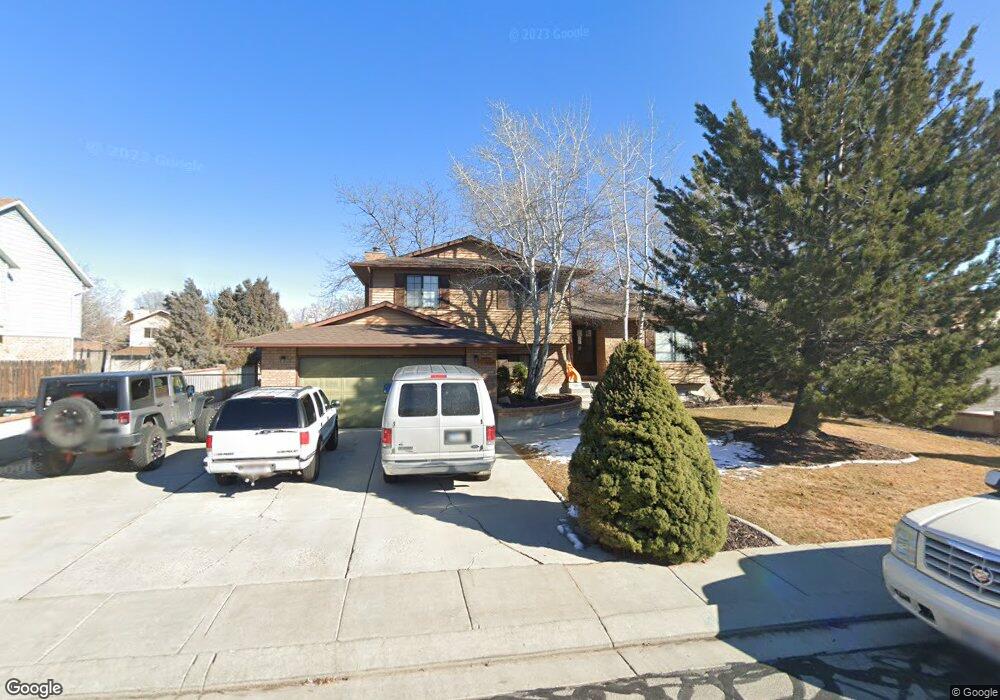
6855 S 3335 W West Jordan, UT 84084
Estimated Value: $548,000 - $620,000
5
Beds
4
Baths
3,200
Sq Ft
$181/Sq Ft
Est. Value
About This Home
This home is located at 6855 S 3335 W, West Jordan, UT 84084 and is currently estimated at $577,636, approximately $180 per square foot. 6855 S 3335 W is a home located in Salt Lake County with nearby schools including West Jordan Middle School, West Jordan High School, and Learning Tree School - Southwest.
Ownership History
Date
Name
Owned For
Owner Type
Purchase Details
Closed on
Jul 1, 2011
Sold by
Kt & T Inc
Bought by
Kt & T Ventures Llc
Current Estimated Value
Home Financials for this Owner
Home Financials are based on the most recent Mortgage that was taken out on this home.
Original Mortgage
$365,000
Outstanding Balance
$250,991
Interest Rate
4.5%
Mortgage Type
Purchase Money Mortgage
Estimated Equity
$326,645
Purchase Details
Closed on
Sep 9, 2000
Sold by
Futures Through Choices Inc
Bought by
Kt & T Inc
Purchase Details
Closed on
Aug 3, 1999
Sold by
Josie Joe A and Josie Tara L
Bought by
Futures Through Choices Inc
Home Financials for this Owner
Home Financials are based on the most recent Mortgage that was taken out on this home.
Original Mortgage
$107,877
Interest Rate
7.64%
Create a Home Valuation Report for This Property
The Home Valuation Report is an in-depth analysis detailing your home's value as well as a comparison with similar homes in the area
Home Values in the Area
Average Home Value in this Area
Purchase History
| Date | Buyer | Sale Price | Title Company |
|---|---|---|---|
| Kt & T Ventures Llc | -- | Inwest Title Service Layton | |
| Kt & T Inc | -- | Equity Title | |
| Futures Through Choices Inc | -- | Equity Title |
Source: Public Records
Mortgage History
| Date | Status | Borrower | Loan Amount |
|---|---|---|---|
| Open | Kt & T Ventures Llc | $365,000 | |
| Previous Owner | Futures Through Choices Inc | $107,877 |
Source: Public Records
Tax History Compared to Growth
Tax History
| Year | Tax Paid | Tax Assessment Tax Assessment Total Assessment is a certain percentage of the fair market value that is determined by local assessors to be the total taxable value of land and additions on the property. | Land | Improvement |
|---|---|---|---|---|
| 2025 | $2,668 | $531,900 | $119,600 | $412,300 |
| 2024 | $2,668 | $513,400 | $115,700 | $397,700 |
| 2023 | $2,604 | $472,100 | $111,200 | $360,900 |
| 2022 | $2,704 | $482,300 | $109,000 | $373,300 |
| 2021 | $2,263 | $367,500 | $86,300 | $281,200 |
| 2020 | $2,102 | $320,400 | $80,600 | $239,800 |
| 2019 | $2,127 | $317,900 | $80,600 | $237,300 |
| 2018 | $1,931 | $286,200 | $76,100 | $210,100 |
| 2017 | $0 | $264,700 | $76,100 | $188,600 |
| 2016 | $0 | $238,100 | $76,100 | $162,000 |
| 2015 | $1,735 | $234,600 | $80,100 | $154,500 |
| 2014 | -- | $221,900 | $76,300 | $145,600 |
Source: Public Records
Map
Nearby Homes
- 3383 W 6880 S
- 6893 S 3200 W
- 6672 S 3335 W
- 6968 S 3535 W Unit 3
- 6980 S 3535 W Unit 2
- 6863 S Dixie Dr
- 8524 S Michele River Ave W Unit 109
- 6482 S Gold Medal Dr
- 3660 Ashland Cir
- 3226 Tysonbrook Ct
- 6453 Fremont Peak Cir
- 3695 Carolina Dr
- 3305 W Kingsbrook Ave
- 6512 Timpanogos Way
- 6992 W Terraine Rd
- 3538 W Biathlon Cir
- 6978 W Terraine Rd
- 3537 W Green Springs Ln
- 6622 S Georgia Dr
- 3770 W Carolina Dr