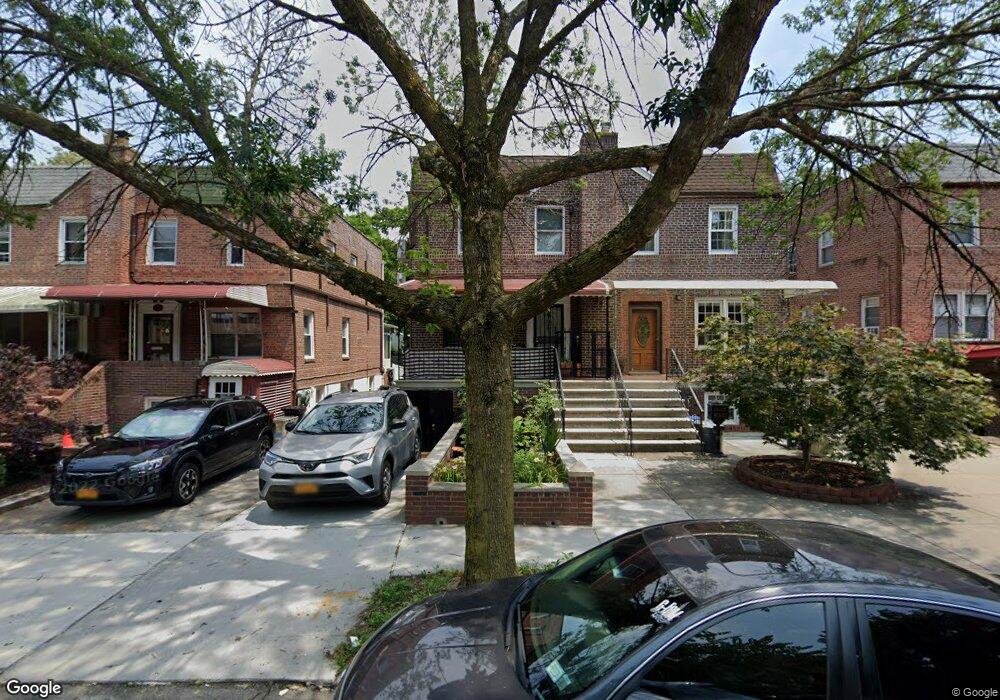
6855 Selfridge St Forest Hills, NY 11375
Forest Hills NeighborhoodEstimated Value: $1,184,000 - $1,405,006
4
Beds
3
Baths
3,096
Sq Ft
$428/Sq Ft
Est. Value
About This Home
This home is located at 6855 Selfridge St, Forest Hills, NY 11375 and is currently estimated at $1,325,502, approximately $428 per square foot. 6855 Selfridge St is a home located in Queens County with nearby schools including Ps 144 Col Jeromus Remsen, J.H.S. 190 Russell Sage, and Queens Metropolitan High School.
Ownership History
Date
Name
Owned For
Owner Type
Purchase Details
Closed on
Aug 13, 2019
Sold by
Bonheur George B
Bought by
Cho Cathy and Cho Janet
Current Estimated Value
Home Financials for this Owner
Home Financials are based on the most recent Mortgage that was taken out on this home.
Original Mortgage
$876,000
Outstanding Balance
$767,214
Interest Rate
3.7%
Mortgage Type
Purchase Money Mortgage
Estimated Equity
$558,288
Purchase Details
Closed on
Nov 16, 2018
Sold by
6855 Selfridge Llc
Bought by
Bonheur George B
Purchase Details
Closed on
May 22, 2017
Sold by
Jason Fink Deceased
Bought by
6855 Selfridge Llc
Purchase Details
Closed on
Oct 31, 2003
Sold by
Boudana Joseph J
Bought by
Fink Jason
Home Financials for this Owner
Home Financials are based on the most recent Mortgage that was taken out on this home.
Original Mortgage
$300,000
Interest Rate
5.8%
Mortgage Type
Purchase Money Mortgage
Create a Home Valuation Report for This Property
The Home Valuation Report is an in-depth analysis detailing your home's value as well as a comparison with similar homes in the area
Home Values in the Area
Average Home Value in this Area
Purchase History
| Date | Buyer | Sale Price | Title Company |
|---|---|---|---|
| Cho Cathy | $1,095,000 | -- | |
| Bonheur George B | -- | -- | |
| 6855 Selfridge Llc | $925,000 | -- | |
| Fink Jason | $530,000 | -- |
Source: Public Records
Mortgage History
| Date | Status | Borrower | Loan Amount |
|---|---|---|---|
| Open | Cho Cathy | $876,000 | |
| Previous Owner | Fink Jason | $300,000 |
Source: Public Records
Tax History Compared to Growth
Tax History
| Year | Tax Paid | Tax Assessment Tax Assessment Total Assessment is a certain percentage of the fair market value that is determined by local assessors to be the total taxable value of land and additions on the property. | Land | Improvement |
|---|---|---|---|---|
| 2025 | $9,915 | $52,327 | $11,809 | $40,518 |
| 2024 | $9,915 | $49,366 | $10,465 | $38,901 |
| 2023 | $9,915 | $49,366 | $9,462 | $39,904 |
| 2022 | $9,780 | $85,620 | $16,560 | $69,060 |
| 2021 | $9,727 | $80,100 | $16,560 | $63,540 |
| 2020 | $9,230 | $69,660 | $16,560 | $53,100 |
| 2019 | $8,606 | $59,640 | $16,560 | $43,080 |
| 2018 | $8,386 | $41,138 | $11,586 | $29,552 |
| 2017 | $8,323 | $40,827 | $13,543 | $27,284 |
| 2016 | $7,700 | $40,827 | $13,543 | $27,284 |
| 2015 | -- | $36,338 | $15,035 | $21,303 |
| 2014 | -- | $34,282 | $13,476 | $20,806 |
Source: Public Records
Map
Nearby Homes
- 68-15 Selfridge Stre 68-15 Selfridge St Unit 5G
- 68-15 Selfridge St Unit 3J
- 68-15 Selfridge St Unit 5D
- 68-15 Selfridge St Unit 1J
- 68-20 Selfridge St Unit 6H
- 68-20 Selfridge St Unit 6J
- 69-01 Alderton St
- 90-01 68th Ave
- 6897 Alderton St
- 6915 Loubet St
- 6828 Kessel St
- 91-11 68th Ave
- 100-33 Metropolitan Ave
- 68-37 Kessel St
- 68-09 Alderton St
- 7445 Yellowstone Blvd Unit 5G
- 7445 Yellowstone Blvd Unit 5C
- 7445 Yellowstone Blvd Unit 2A
- 70-19 Manse St
- 74-45 Yellowstone Blvd Unit 1A
- 6855 Selfridge St
- 68-59 Selfridge St Unit GR
- 68-59 Selfridge St Unit 1
- 68-59 Selfridge St Unit 1st Fl
- 6853 Selfridge St
- 6853 Selfridge St
- 6859 Selfridge St
- 68-61 Selfridge St Unit 1
- 68-61' Selfridge St
- 68-61 Selfridge St
- 68-61 Selfridge St Unit 1+2FL
- 6849 Selfridge St
- 6861 Selfridge St
- 6863 Selfridge St
- 6847 Selfridge St
- 68-63 Selfridge St Unit 1Fl
- 6847 Selfridge St
- 6865 Selfridge St
- 6865 Selfridge St
- 68-45 Selfridge St Unit 1