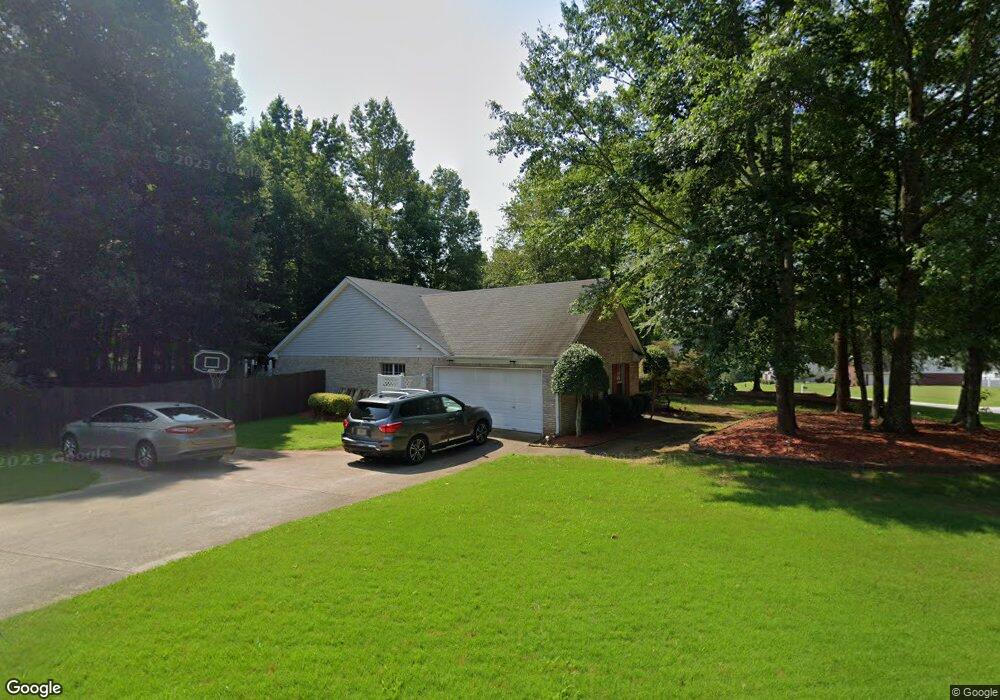
686 Monte Ln Jefferson, GA 30549
Estimated Value: $375,000 - $392,000
4
Beds
2
Baths
1,985
Sq Ft
$192/Sq Ft
Est. Value
About This Home
This home is located at 686 Monte Ln, Jefferson, GA 30549 and is currently estimated at $380,855, approximately $191 per square foot. 686 Monte Ln is a home located in Jackson County with nearby schools including Jefferson Elementary School, Jefferson Academy, and Jefferson Middle School.
Ownership History
Date
Name
Owned For
Owner Type
Purchase Details
Closed on
Aug 31, 2018
Sold by
Smith Eric
Bought by
Smith Eric and Smith Alexandra
Current Estimated Value
Home Financials for this Owner
Home Financials are based on the most recent Mortgage that was taken out on this home.
Original Mortgage
$184,848
Outstanding Balance
$161,213
Interest Rate
4.6%
Mortgage Type
New Conventional
Estimated Equity
$219,642
Purchase Details
Closed on
Feb 18, 2013
Sold by
Wilkerson Gerald E
Bought by
Wilkerson Barbara E
Purchase Details
Closed on
Jul 9, 2004
Sold by
Morrow Gary L and Morrow Lynd
Bought by
Wilkerson Barbara E
Purchase Details
Closed on
Sep 5, 2000
Sold by
B & H Homes Inc
Bought by
Morrow Gary L and Morrow Lynd
Purchase Details
Closed on
Feb 22, 2000
Sold by
Holders Mill Lp
Bought by
B & H Homes Inc
Create a Home Valuation Report for This Property
The Home Valuation Report is an in-depth analysis detailing your home's value as well as a comparison with similar homes in the area
Home Values in the Area
Average Home Value in this Area
Purchase History
| Date | Buyer | Sale Price | Title Company |
|---|---|---|---|
| Smith Eric | -- | -- | |
| Smith Eric | $20,500 | -- | |
| Wilkerson Barbara E | -- | -- | |
| Wilkerson Barbara E | $144,000 | -- | |
| Morrow Gary L | $134,900 | -- | |
| B & H Homes Inc | $308,000 | -- |
Source: Public Records
Mortgage History
| Date | Status | Borrower | Loan Amount |
|---|---|---|---|
| Open | Smith Eric | $184,848 | |
| Closed | Smith Eric | $184,848 |
Source: Public Records
Tax History Compared to Growth
Tax History
| Year | Tax Paid | Tax Assessment Tax Assessment Total Assessment is a certain percentage of the fair market value that is determined by local assessors to be the total taxable value of land and additions on the property. | Land | Improvement |
|---|---|---|---|---|
| 2024 | $3,402 | $124,440 | $24,800 | $99,640 |
| 2023 | $3,416 | $113,720 | $24,800 | $88,920 |
| 2022 | $3,209 | $100,400 | $24,800 | $75,600 |
| 2021 | $2,848 | $87,600 | $12,000 | $75,600 |
| 2020 | $2,574 | $74,080 | $12,000 | $62,080 |
| 2019 | $2,336 | $66,280 | $12,000 | $54,280 |
| 2018 | $2,260 | $63,680 | $12,000 | $51,680 |
| 2017 | $2,223 | $61,373 | $12,000 | $49,373 |
| 2016 | $2,233 | $61,373 | $12,000 | $49,373 |
| 2015 | $2,037 | $55,822 | $8,800 | $47,022 |
| 2014 | $2,005 | $54,428 | $8,800 | $45,628 |
| 2013 | -- | $54,428 | $8,800 | $45,628 |
Source: Public Records
Map
Nearby Homes
- 24 Douglas Dr
- 340 Thornhill Cir
- 302 Thornhill Cir
- 279 Adventure Trail
- 514 Adventure Trail
- 899 Rocky Springs Dr
- 1354 Washington St
- 222 Jett Roberts Rd
- 816 Mimosa Way
- 865 Elder Dr
- 233 Red Dragon Dr
- 1433 Jefferson Walk Cir
- 352 Lakeshore Dr
- 105 Grand Oak Dr
- 107 Laurel Oaks Ln
- 55 Grand Oak Dr
- 2197 Holders Siding Rd
- 180 Laurel Oaks Ln
- 206 Blue Dragon Dr
- 584 Jefferson Walk Cir
- 655 Monte Ln
- 628 Monte Ln
- 677 Monte Ln
- 691 Monte Ln
- 665 Monte Ln
- 604 Monte Ln
- 633 Monte Ln
- 20 Field Stone Cir
- 609 Monte Ln
- 715 Monte Ln
- 667 Monte Ln Unit 74
- 667 Monte Ln
- 58 Field Stone Cir
- 576 Monte Ln
- 0 Field Stone Cir Unit 7161447
- 741 Monte Ln
- 589 Monte Ln
- 582 Monte Ln
- 767 Monte Ln
- 76 Field Stone Cir