Estimated Value: $207,000 - $245,000
3
Beds
1
Bath
1,778
Sq Ft
$131/Sq Ft
Est. Value
About This Home
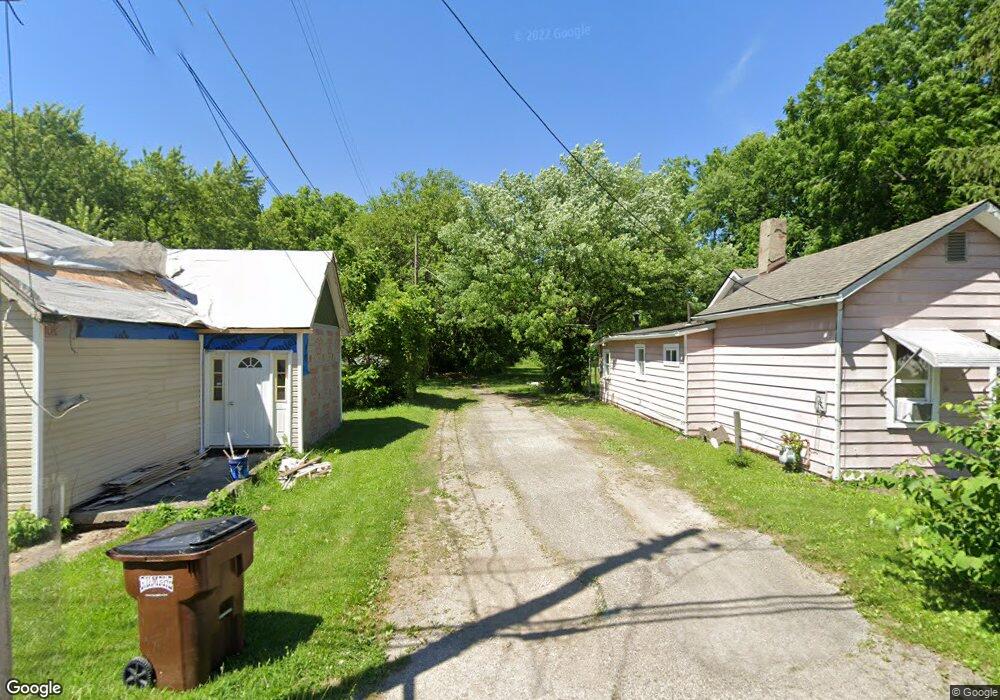
This home is located at 686 N West St, Xenia, OH 45385 and is currently estimated at $233,449, approximately $131 per square foot. 686 N West St is a home located in Greene County with nearby schools including Xenia High School, Summit Academy Community School for Alternative Learners - Xenia, and Legacy Christian Academy.
Ownership History
Date
Name
Owned For
Owner Type
Purchase Details
Closed on
Nov 16, 2021
Sold by
Boude Michael Lee and Boude Bernice
Bought by
Hammond Richard D and Hammond Judith M
Current Estimated Value
Purchase Details
Closed on
Feb 12, 2004
Sold by
Jlz Enterprises Inc
Bought by
Boude Michael Lee and Vergil M Burkett & Norma J Burkett Irrev
Purchase Details
Closed on
Jan 23, 2004
Sold by
Vanderwal Harry R and Vanderwal Echo T
Bought by
Jlz Enterprises Inc
Purchase Details
Closed on
Feb 13, 2003
Sold by
Bank One Na
Bought by
Vanderwal Harry R and Vanderwal Echo T
Purchase Details
Closed on
Oct 28, 2002
Sold by
Begley Beth A
Bought by
Bank One Na
Purchase Details
Closed on
Sep 19, 1995
Sold by
Galliger Margaret J
Bought by
Begley Beth A
Home Financials for this Owner
Home Financials are based on the most recent Mortgage that was taken out on this home.
Original Mortgage
$71,200
Interest Rate
7.81%
Mortgage Type
New Conventional
Create a Home Valuation Report for This Property
The Home Valuation Report is an in-depth analysis detailing your home's value as well as a comparison with similar homes in the area
Home Values in the Area
Average Home Value in this Area
Purchase History
| Date | Buyer | Sale Price | Title Company |
|---|---|---|---|
| Hammond Richard D | $180,000 | None Available | |
| Boude Michael Lee | $84,000 | -- | |
| Jlz Enterprises Inc | -- | -- | |
| Vanderwal Harry R | $65,000 | -- | |
| Bank One Na | $57,000 | -- | |
| Bank One Na | $57,000 | -- | |
| Begley Beth A | $75,000 | -- |
Source: Public Records
Mortgage History
| Date | Status | Borrower | Loan Amount |
|---|---|---|---|
| Previous Owner | Begley Beth A | $71,200 |
Source: Public Records
Tax History Compared to Growth
Tax History
| Year | Tax Paid | Tax Assessment Tax Assessment Total Assessment is a certain percentage of the fair market value that is determined by local assessors to be the total taxable value of land and additions on the property. | Land | Improvement |
|---|---|---|---|---|
| 2024 | $2,268 | $54,390 | $11,500 | $42,890 |
| 2023 | $2,268 | $54,390 | $11,500 | $42,890 |
| 2022 | $1,956 | $38,980 | $7,190 | $31,790 |
| 2021 | $1,982 | $38,980 | $7,190 | $31,790 |
| 2020 | $1,899 | $38,980 | $7,190 | $31,790 |
| 2019 | $1,900 | $36,710 | $7,750 | $28,960 |
| 2018 | $1,907 | $36,710 | $7,750 | $28,960 |
| 2017 | $1,852 | $36,710 | $7,750 | $28,960 |
| 2016 | $1,873 | $35,380 | $7,750 | $27,630 |
| 2015 | $1,878 | $35,380 | $7,750 | $27,630 |
| 2014 | $1,798 | $35,380 | $7,750 | $27,630 |
Source: Public Records
Map
Nearby Homes
- 613 N West St
- 659 N King St
- 516 N King St
- 878 N Detroit St
- 902 N Detroit St
- 137 Pleasant St
- 509 Antrim Rd
- 1038 Frederick Dr
- 883 Omard Dr
- 912 Omard Dr
- 1171 N Detroit St
- 0 W Church St
- 119 Park Dr
- 214 Corwin Ave
- 348 S Stadium Dr
- 479 N Stadium Dr
- 508 Marshall Dr
- 513 Redbud Ln
- 343 Sheelin Rd
- 568 Louise Dr