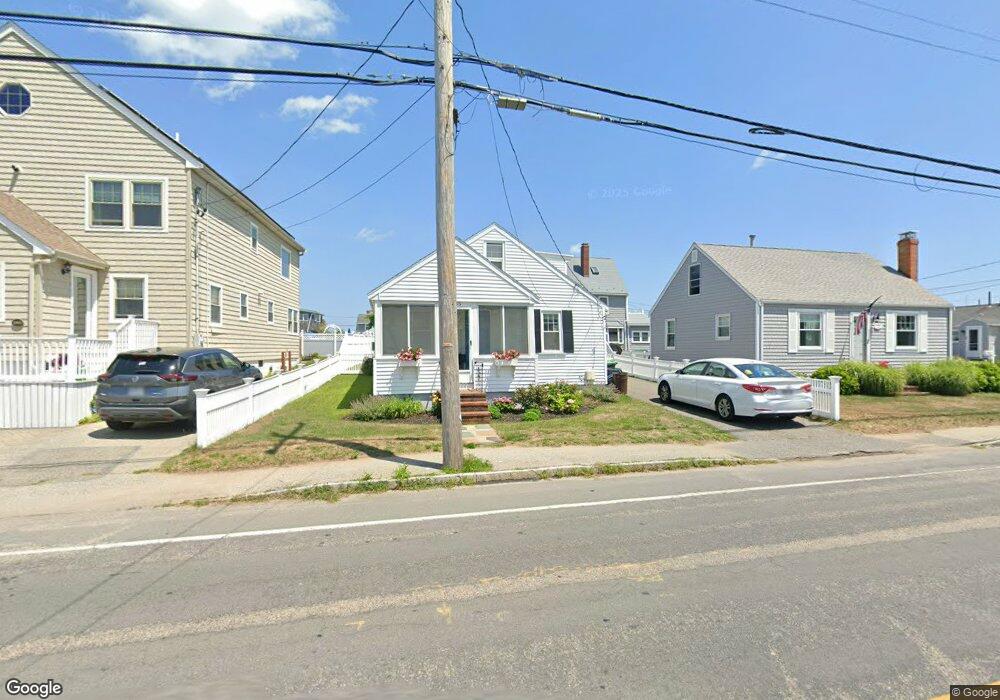
686 Ocean St Marshfield, MA 02050
Ocean Bluff-Brant Rock NeighborhoodEstimated Value: $569,000 - $655,000
4
Beds
2
Baths
907
Sq Ft
$681/Sq Ft
Est. Value
About This Home
This home is located at 686 Ocean St, Marshfield, MA 02050 and is currently estimated at $617,445, approximately $680 per square foot. 686 Ocean St is a home with nearby schools including Daniel Webster, Furnace Brook Middle School, and Marshfield High School.
Ownership History
Date
Name
Owned For
Owner Type
Purchase Details
Closed on
Nov 22, 2013
Sold by
Brown Jessica L and Brown Michael J
Bought by
Brown Jessica L
Current Estimated Value
Purchase Details
Closed on
Oct 31, 2002
Sold by
Fletcher Brian
Bought by
Brown Michael J and Brown Jessica L
Home Financials for this Owner
Home Financials are based on the most recent Mortgage that was taken out on this home.
Original Mortgage
$171,000
Interest Rate
6.09%
Mortgage Type
Purchase Money Mortgage
Create a Home Valuation Report for This Property
The Home Valuation Report is an in-depth analysis detailing your home's value as well as a comparison with similar homes in the area
Home Values in the Area
Average Home Value in this Area
Purchase History
| Date | Buyer | Sale Price | Title Company |
|---|---|---|---|
| Brown Jessica L | -- | -- | |
| Brown Jessica L | -- | -- | |
| Brown Michael J | $180,000 | -- | |
| Brown Michael J | $180,000 | -- |
Source: Public Records
Mortgage History
| Date | Status | Borrower | Loan Amount |
|---|---|---|---|
| Previous Owner | Brown Michael J | $25,000 | |
| Previous Owner | Brown Michael J | $173,000 | |
| Previous Owner | Brown Michael J | $171,000 |
Source: Public Records
Tax History Compared to Growth
Tax History
| Year | Tax Paid | Tax Assessment Tax Assessment Total Assessment is a certain percentage of the fair market value that is determined by local assessors to be the total taxable value of land and additions on the property. | Land | Improvement |
|---|---|---|---|---|
| 2025 | $5,101 | $515,300 | $376,400 | $138,900 |
| 2024 | $5,062 | $487,200 | $356,600 | $130,600 |
| 2023 | $4,486 | $417,000 | $309,100 | $107,900 |
| 2022 | $4,486 | $346,400 | $247,600 | $98,800 |
| 2021 | $4,446 | $337,100 | $247,600 | $89,500 |
| 2020 | $4,431 | $332,400 | $247,600 | $84,800 |
| 2019 | $4,385 | $327,700 | $247,600 | $80,100 |
| 2018 | $3,852 | $288,100 | $208,000 | $80,100 |
| 2017 | $3,784 | $275,800 | $208,000 | $67,800 |
| 2016 | $3,828 | $275,800 | $208,000 | $67,800 |
| 2015 | $3,534 | $265,900 | $198,100 | $67,800 |
| 2014 | $3,663 | $275,600 | $208,000 | $67,600 |
Source: Public Records
Map
Nearby Homes
- 19 2nd Rd
- 122 June St
- 78 Tower Ave
- 256 Ocean St
- 38 Winthrop Dr
- 106 Careswell St
- 30 Chandler Dr
- 51 Wellington Ave
- 42 Carr Rd
- 8 Duxbury St
- 86 Barouche Dr
- 145 Peterson Path
- 92 Salt Meadow Waye
- 1801 Ocean St Unit B31
- 71 Gurnet Rd
- 713 Webster St
- 255 Ridge Rd
- 39 High Beacon Way
- 566 Holly Rd
- 184 King Phillips Pathe