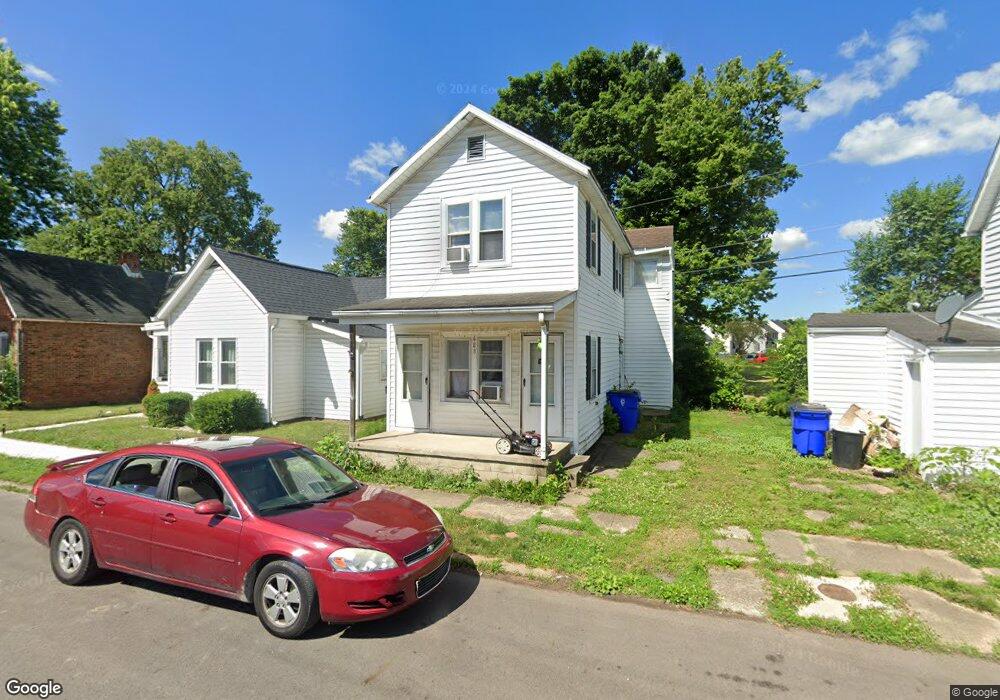
686 Vine St Chillicothe, OH 45601
Estimated Value: $70,000 - $152,000
--
Bed
2
Baths
1,092
Sq Ft
$86/Sq Ft
Est. Value
About This Home
This home is located at 686 Vine St, Chillicothe, OH 45601 and is currently estimated at $94,108, approximately $86 per square foot. 686 Vine St is a home located in Ross County with nearby schools including Chillicothe High School and Wesley Taylor Preparatory School.
Ownership History
Date
Name
Owned For
Owner Type
Purchase Details
Closed on
Jan 21, 2020
Sold by
Sharp Joseph T
Bought by
J And E Development Llc
Current Estimated Value
Home Financials for this Owner
Home Financials are based on the most recent Mortgage that was taken out on this home.
Original Mortgage
$52,500
Outstanding Balance
$35,989
Interest Rate
3.7%
Mortgage Type
Commercial
Estimated Equity
$58,119
Purchase Details
Closed on
Dec 23, 2008
Sold by
Beeson Teresa L and Beeson Gary L
Bought by
Sharp Joseph T
Purchase Details
Closed on
Dec 8, 2008
Sold by
Morehouse Group Limited
Bought by
Beeson Teresa L
Purchase Details
Closed on
Feb 2, 2006
Sold by
The Morehouse Group Ltd
Bought by
Saxour Crystal J
Home Financials for this Owner
Home Financials are based on the most recent Mortgage that was taken out on this home.
Original Mortgage
$38,900
Interest Rate
9%
Mortgage Type
Seller Take Back
Purchase Details
Closed on
Nov 17, 2005
Sold by
Hitchens Wayne A
Bought by
Morehouse Group
Create a Home Valuation Report for This Property
The Home Valuation Report is an in-depth analysis detailing your home's value as well as a comparison with similar homes in the area
Home Values in the Area
Average Home Value in this Area
Purchase History
| Date | Buyer | Sale Price | Title Company |
|---|---|---|---|
| J And E Development Llc | $35,000 | Northwest Ttl Fam Of Compani | |
| Sharp Joseph T | $40,000 | None Available | |
| Beeson Teresa L | -- | None Available | |
| Saxour Crystal J | $39,900 | None Available | |
| Morehouse Group | $20,200 | None Available |
Source: Public Records
Mortgage History
| Date | Status | Borrower | Loan Amount |
|---|---|---|---|
| Open | J And E Development Llc | $52,500 | |
| Previous Owner | Saxour Crystal J | $38,900 |
Source: Public Records
Tax History Compared to Growth
Tax History
| Year | Tax Paid | Tax Assessment Tax Assessment Total Assessment is a certain percentage of the fair market value that is determined by local assessors to be the total taxable value of land and additions on the property. | Land | Improvement |
|---|---|---|---|---|
| 2024 | $435 | $10,660 | $1,540 | $9,120 |
| 2023 | $442 | $10,660 | $1,540 | $9,120 |
| 2022 | $443 | $10,660 | $1,540 | $9,120 |
| 2021 | $444 | $9,370 | $1,390 | $7,980 |
| 2020 | $444 | $9,370 | $1,390 | $7,980 |
| 2019 | $444 | $9,370 | $1,390 | $7,980 |
| 2018 | $423 | $8,460 | $1,390 | $7,070 |
| 2017 | $456 | $8,460 | $1,390 | $7,070 |
| 2016 | $452 | $8,460 | $1,390 | $7,070 |
| 2015 | $411 | $7,510 | $1,390 | $6,120 |
| 2014 | $403 | $7,510 | $1,390 | $6,120 |
| 2013 | $404 | $7,510 | $1,390 | $6,120 |
Source: Public Records
Map
Nearby Homes
- 583 Cedar St
- 637 Linn St
- 387 Church St
- 342 N High St
- 625 Oneida Rd
- 322 Vine St
- 346 Yoctangee Pkwy
- 288 Church St
- 299 N High St
- 265 N High St
- 228 Locust St
- 163 Vine St
- 166 N High St
- 200 Winona Blvd
- 15 Windsor Dr
- 215 W 2nd St
- 128 Maplewood Dr
- 9 Kensington Dr
- 7 Kensington Dr
- 14996 Pleasant Valley Rd Unit Lot 53