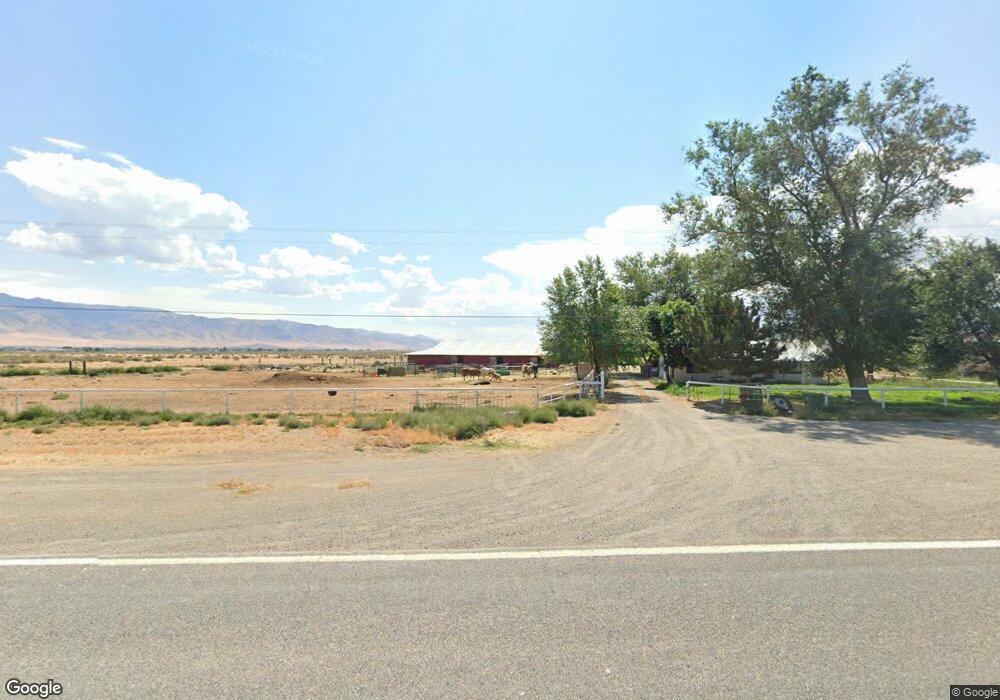
6860 W Rose Creek Rd Winnemucca, NV 89445
Estimated Value: $371,040 - $436,000
3
Beds
2
Baths
8,387
Sq Ft
$48/Sq Ft
Est. Value
About This Home
This home is located at 6860 W Rose Creek Rd, Winnemucca, NV 89445 and is currently estimated at $403,760, approximately $48 per square foot. 6860 W Rose Creek Rd is a home located in Humboldt County with nearby schools including Grass Valley Elementary School, Winnemucca Junior High School, and French Ford Middle School.
Ownership History
Date
Name
Owned For
Owner Type
Purchase Details
Closed on
Aug 13, 2015
Sold by
Turnipseed John Tyler
Bought by
Estill Cole and Estill Kathleen Elise
Current Estimated Value
Home Financials for this Owner
Home Financials are based on the most recent Mortgage that was taken out on this home.
Original Mortgage
$230,000
Interest Rate
4.05%
Mortgage Type
Purchase Money Mortgage
Create a Home Valuation Report for This Property
The Home Valuation Report is an in-depth analysis detailing your home's value as well as a comparison with similar homes in the area
Home Values in the Area
Average Home Value in this Area
Purchase History
| Date | Buyer | Sale Price | Title Company |
|---|---|---|---|
| Estill Cole | $230,000 | None Available |
Source: Public Records
Mortgage History
| Date | Status | Borrower | Loan Amount |
|---|---|---|---|
| Previous Owner | Estill Cole | $230,000 |
Source: Public Records
Tax History Compared to Growth
Tax History
| Year | Tax Paid | Tax Assessment Tax Assessment Total Assessment is a certain percentage of the fair market value that is determined by local assessors to be the total taxable value of land and additions on the property. | Land | Improvement |
|---|---|---|---|---|
| 2025 | $1,295 | $62,611 | $7,003 | $55,608 |
| 2024 | $1,582 | $64,679 | $7,003 | $57,675 |
| 2023 | $1,259 | $59,818 | $0 | $0 |
| 2022 | $1,194 | $51,059 | $5,600 | $45,459 |
| 2021 | $1,163 | $49,949 | $5,600 | $44,349 |
| 2020 | $1,133 | $43,467 | $5,600 | $37,867 |
| 2019 | $1,102 | $42,347 | $5,600 | $36,747 |
| 2018 | $1,079 | $41,350 | $5,600 | $35,750 |
| 2017 | $1,089 | $41,793 | $5,600 | $36,193 |
| 2016 | $1,075 | $39,973 | $5,600 | $34,373 |
| 2015 | $1,012 | $39,181 | $5,600 | $33,581 |
| 2014 | $1,012 | $38,816 | $5,600 | $33,216 |
Source: Public Records
Map
Nearby Homes
- 6825 W Rose Creek Rd
- 6995 W Rose Creek Rd
- 7275 W Rose Creek Rd
- 6225 Sand Creek Cir
- 6990 Airport Rd
- 6985 Sand Creek Cir
- 03 Commercial St
- 0 W Rose Creek Rd Unit 240005502
- 5525 W Commander Dr
- 14-0251-04 Wild Horse Rd
- 14-0201-10 Wild Horse Rd
- 8150 Herschell Rd
- 101 de Giorgio Ln
- 5700 Bird Ln
- 6305 Silver Knolls Ct
- 6530 Bonanza Dr
- 6245 Prospect Ave
- 6240 Bonanza Dr
- 4370 W Commander Dr
- 4140 Bonanza Cir
- 6900 W Rose Creek Rd
- 6895 W Rose Creek Rd
- 6865 W Rose Creek Rd
- 6940 W Rose Creek Rd
- 6945 W Rose Creek Rd
- 7045 Pine Rd
- 6990 W Rose Creek Rd
- 9375 Pine Rd
- 7195 W Rose Creek Rd
- 7200 Pine Rd
- 7215 W Rose Creek Rd
- 0 Sand Creek Cir Unit 230013034
- 6990 Pine Rd
- 7400 Pine Rd
- 7260 W Rose Creek Rd
- 7100 Commercial St
- 6335 W Rose Creek Rd
- 7120 Market St
- 0000 Rose Creek Rd Apn1023330
- 6315 W Rose Creek Rd