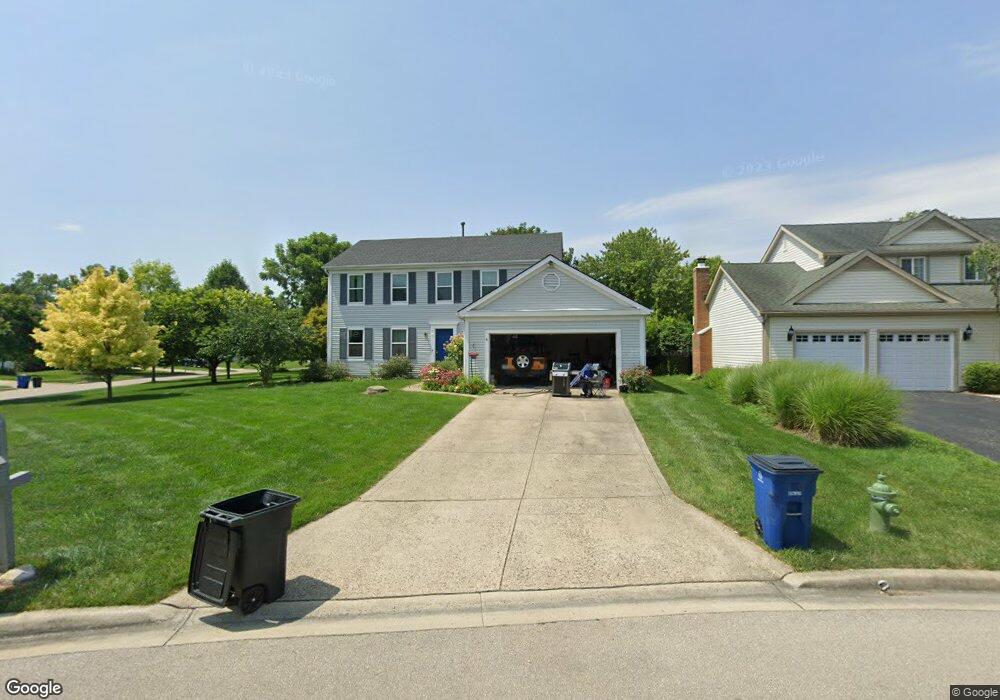
6861 Erie Ct Dublin, OH 43017
Estimated Value: $533,647 - $565,000
4
Beds
3
Baths
2,770
Sq Ft
$197/Sq Ft
Est. Value
About This Home
This home is located at 6861 Erie Ct, Dublin, OH 43017 and is currently estimated at $546,162, approximately $197 per square foot. 6861 Erie Ct is a home located in Franklin County with nearby schools including Scottish Corners Elementary School, Henry Karrer Middle School, and Dublin Coffman High School.
Ownership History
Date
Name
Owned For
Owner Type
Purchase Details
Closed on
Oct 23, 2009
Sold by
Crawford Rhonda J
Bought by
Richards Mathew and Richards Jessica R
Current Estimated Value
Home Financials for this Owner
Home Financials are based on the most recent Mortgage that was taken out on this home.
Original Mortgage
$194,000
Outstanding Balance
$126,873
Interest Rate
5.11%
Mortgage Type
New Conventional
Estimated Equity
$419,289
Purchase Details
Closed on
Dec 17, 2004
Sold by
Bowen Larry D and Bowen Juliana G
Bought by
Crawford Rhonda J
Home Financials for this Owner
Home Financials are based on the most recent Mortgage that was taken out on this home.
Original Mortgage
$124,000
Interest Rate
5.78%
Mortgage Type
Purchase Money Mortgage
Purchase Details
Closed on
Mar 27, 1987
Bought by
Bowen Larry D and Bowen Juliana G
Create a Home Valuation Report for This Property
The Home Valuation Report is an in-depth analysis detailing your home's value as well as a comparison with similar homes in the area
Home Values in the Area
Average Home Value in this Area
Purchase History
| Date | Buyer | Sale Price | Title Company |
|---|---|---|---|
| Richards Mathew | $243,000 | Title First | |
| Crawford Rhonda J | $224,000 | Chicago Tit | |
| Bowen Larry D | $98,900 | -- |
Source: Public Records
Mortgage History
| Date | Status | Borrower | Loan Amount |
|---|---|---|---|
| Open | Richards Mathew | $194,000 | |
| Closed | Crawford Rhonda J | $124,000 |
Source: Public Records
Tax History Compared to Growth
Tax History
| Year | Tax Paid | Tax Assessment Tax Assessment Total Assessment is a certain percentage of the fair market value that is determined by local assessors to be the total taxable value of land and additions on the property. | Land | Improvement |
|---|---|---|---|---|
| 2024 | $8,609 | $142,310 | $35,700 | $106,610 |
| 2023 | $8,530 | $142,310 | $35,700 | $106,610 |
| 2022 | $7,340 | $113,470 | $31,500 | $81,970 |
| 2021 | $7,358 | $113,470 | $31,500 | $81,970 |
| 2020 | $7,419 | $113,470 | $31,500 | $81,970 |
| 2019 | $6,866 | $94,470 | $26,250 | $68,220 |
| 2018 | $6,435 | $94,470 | $26,250 | $68,220 |
| 2017 | $6,163 | $94,470 | $26,250 | $68,220 |
| 2016 | $5,936 | $83,520 | $17,190 | $66,330 |
| 2015 | $5,975 | $83,520 | $17,190 | $66,330 |
| 2014 | $5,982 | $83,520 | $17,190 | $66,330 |
| 2013 | $2,882 | $79,555 | $16,380 | $63,175 |
Source: Public Records
Map
Nearby Homes
- 6992 Beery Ln
- 5912 Tara Hill Dr
- 9786 Mesquite Ct
- 7199 Achill Dr
- 7168 Innisfree Ct
- 6937 Dublin Village Dr
- 6987 Dublin Village Dr
- 6956 Avery Rd
- 6117 Craughwell Ln
- 7246 Sundown Ct
- 6049 Craughwell Ln Unit 4
- 5578 Corey Swirl Dr
- 6124 Inishmore Ln
- 6282 Twonotch Ct
- 7326 Pueblo Ct
- 6254 Inishmore Ln
- 6088 Holywell Dr
- 5735 McNeven Ct
- 6363 Phoenix Park Dr
- 7195 Dominick Ct
- 6871 Erie Ct
- 6882 Black Hawk Ct
- 6882 Blackhawk Ct
- 6874 Black Hawk Ct
- 6881 Erie Ct
- 6890 Black Hawk Ct
- 6683 Fallen Timbers Dr
- 6890 Blackhawk Ct
- 6689 Fallen Timbers Dr
- 6677 Fallen Timbers Dr
- 6695 Fallen Timbers Dr
- 6898 Black Hawk Ct
- 6852 Erie Ct
- 6891 Erie Ct
- 6671 Fallen Timbers Dr
- 6707 Fallen Timbers Dr
- 6862 Erie Ct
- 6665 Fallen Timbers Dr
- 6906 Black Hawk Ct
- 6906 Blackhawk Ct