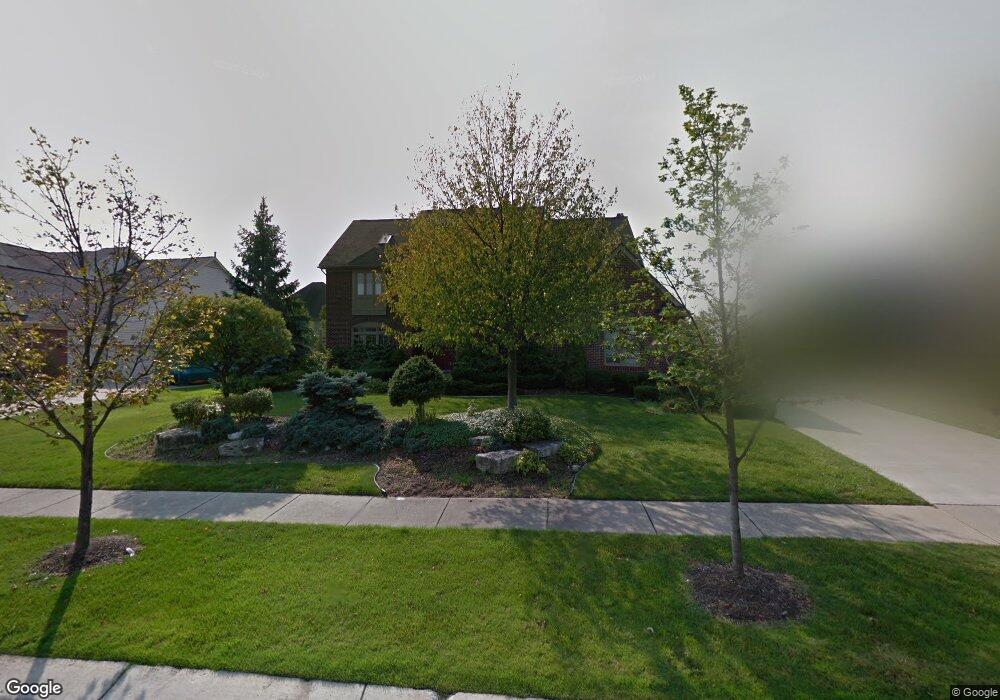
6869 Maple Creek Blvd Unit 229 West Bloomfield, MI 48322
Estimated Value: $789,610 - $912,000
4
Beds
4
Baths
4,259
Sq Ft
$199/Sq Ft
Est. Value
About This Home
This home is located at 6869 Maple Creek Blvd Unit 229, West Bloomfield, MI 48322 and is currently estimated at $849,403, approximately $199 per square foot. 6869 Maple Creek Blvd Unit 229 is a home located in Oakland County with nearby schools including Sheiko Elementary School, West Bloomfield Middle School, and Maria Montessori Center.
Ownership History
Date
Name
Owned For
Owner Type
Purchase Details
Closed on
Nov 10, 2018
Sold by
Abubars Ibrahim and Arman Mohamed
Bought by
Abubars Ibrahim and Dwaik Takween
Current Estimated Value
Home Financials for this Owner
Home Financials are based on the most recent Mortgage that was taken out on this home.
Original Mortgage
$320,000
Outstanding Balance
$201,576
Interest Rate
4.7%
Mortgage Type
New Conventional
Estimated Equity
$647,827
Purchase Details
Closed on
Mar 31, 2011
Sold by
Cox Clayton and Cox Linda
Bought by
Abubars Ibrahim and Arman Mohamed
Purchase Details
Closed on
May 19, 1999
Sold by
Selective-Maple
Bought by
Cox Clayton
Create a Home Valuation Report for This Property
The Home Valuation Report is an in-depth analysis detailing your home's value as well as a comparison with similar homes in the area
Home Values in the Area
Average Home Value in this Area
Purchase History
| Date | Buyer | Sale Price | Title Company |
|---|---|---|---|
| Abubars Ibrahim | -- | Title Solutions Agency Llc | |
| Abubars Ibrahim | $471,000 | Capital Title Ins Agency | |
| Cox Clayton | -- | -- |
Source: Public Records
Mortgage History
| Date | Status | Borrower | Loan Amount |
|---|---|---|---|
| Open | Abubars Ibrahim | $320,000 | |
| Closed | Cox Clayton | -- |
Source: Public Records
Tax History Compared to Growth
Tax History
| Year | Tax Paid | Tax Assessment Tax Assessment Total Assessment is a certain percentage of the fair market value that is determined by local assessors to be the total taxable value of land and additions on the property. | Land | Improvement |
|---|---|---|---|---|
| 2024 | $6,563 | $317,430 | $0 | $0 |
| 2022 | $6,280 | $272,140 | $21,500 | $250,640 |
| 2021 | $10,872 | $274,460 | $0 | $0 |
| 2020 | $5,880 | $269,020 | $21,500 | $247,520 |
| 2018 | $8,901 | $280,430 | $22,500 | $257,930 |
| 2015 | -- | $245,980 | $0 | $0 |
| 2014 | -- | $229,940 | $0 | $0 |
| 2011 | -- | $204,150 | $0 | $0 |
Source: Public Records
Map
Nearby Homes
- 23617 Trailview Dr Unit 29
- 23601 Trailview Dr Unit 37
- 6607 Westbrooke Ct
- 6906 Pebblecreek Woods Dr
- 6904 Pebble Park Cir
- 7277 Simsbury Dr
- 7288 Simsbury Dr Unit 24
- 7118 Pebble Park Dr
- 6684 Stonebridge E
- 6783 Burtonwood Dr
- 5106 Rock Run
- 5216 Brett Ct Unit 53
- 7273 Creeks Bend Ct Unit 88
- 7159 Creeks Crossing Unit 47
- 7208 Creeks Bend Dr Unit 77
- 7006 Bridge Way
- 6323 Potomac Cir Unit 22
- 7663 Danbury Cir
- 6880 Burtonwood Dr
- 7406 Pebble Point
- 6857 Maple Creek Blvd
- 6881 Maple Creek Blvd
- 6902 Trailview Ct
- 6845 Maple Creek Blvd
- 6890 Trailview Ct
- 6893 Maple Creek Blvd
- 6728 Watercroft Ct Unit 184
- 6850 Maple Creek Blvd
- 6874 Maple Creek Blvd Unit 185
- 6914 Trailview Ct
- 6878 Trailview Ct
- 6917 Maple Creek Blvd Unit Bldg-Unit
- 6917 Maple Creek Blvd
- 6821 Maple Creek Blvd Unit 232
- 6704 Watercroft Ct Unit 183
- 6886 Maple Creek Blvd Unit Bldg-Unit
- 6886 Maple Creek Blvd
- 6838 Maple Creek Blvd
- 6898 Maple Creek Blvd
- 6864 Trailview Ct