Estimated Value: $130,000 - $152,806
3
Beds
1
Bath
1,506
Sq Ft
$95/Sq Ft
Est. Value
About This Home
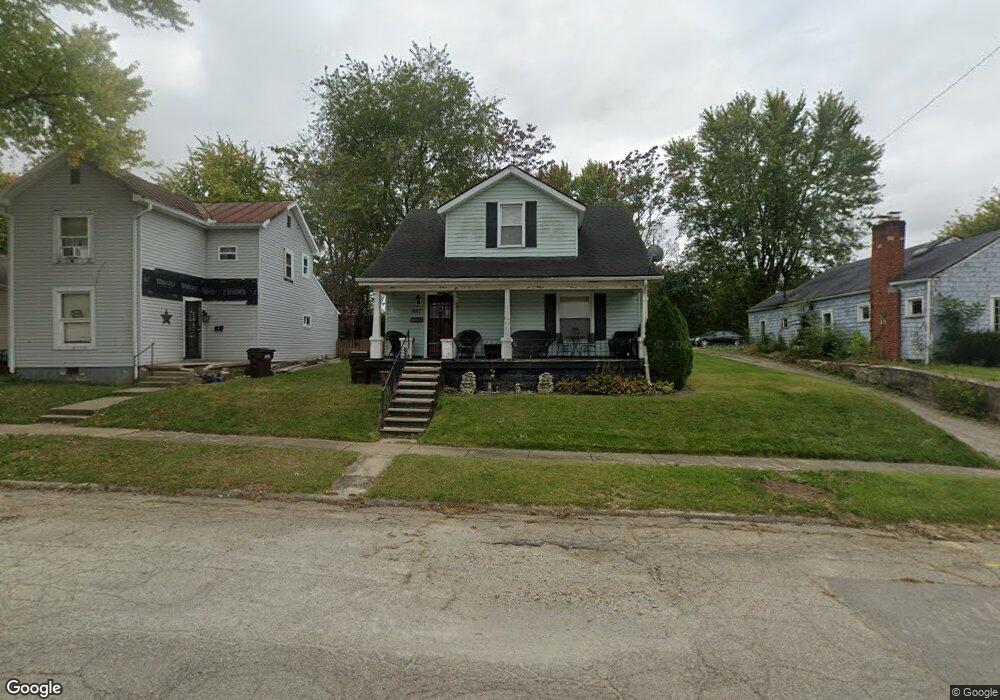
This home is located at 687 E 2nd St, Xenia, OH 45385 and is currently estimated at $142,952, approximately $94 per square foot. 687 E 2nd St is a home located in Greene County with nearby schools including Xenia High School, Summit Academy Community School for Alternative Learners - Xenia, and Legacy Christian Academy.
Ownership History
Date
Name
Owned For
Owner Type
Purchase Details
Closed on
Feb 8, 2011
Sold by
Harding Ramsey Pamela S
Bought by
Harding Ramsey Pamela S and Harding Jeron L
Current Estimated Value
Home Financials for this Owner
Home Financials are based on the most recent Mortgage that was taken out on this home.
Original Mortgage
$86,102
Outstanding Balance
$57,609
Interest Rate
4.78%
Mortgage Type
FHA
Estimated Equity
$85,343
Purchase Details
Closed on
Feb 18, 2010
Sold by
Harding Ramsey Pamela S
Bought by
Harding Ramsey Pamela S and Harding Jeron L
Home Financials for this Owner
Home Financials are based on the most recent Mortgage that was taken out on this home.
Original Mortgage
$63,288
Interest Rate
5.5%
Mortgage Type
FHA
Purchase Details
Closed on
Oct 14, 2008
Sold by
Estate Of Geraldine Harding
Bought by
Ramsey Pamela S Harding
Create a Home Valuation Report for This Property
The Home Valuation Report is an in-depth analysis detailing your home's value as well as a comparison with similar homes in the area
Home Values in the Area
Average Home Value in this Area
Purchase History
| Date | Buyer | Sale Price | Title Company |
|---|---|---|---|
| Harding Ramsey Pamela S | -- | Attorney | |
| Harding Ramsey Pamela S | -- | Attorney | |
| Harding Ramsey Pamela S | -- | Attorney | |
| Ramsey Pamela S Harding | -- | None Available |
Source: Public Records
Mortgage History
| Date | Status | Borrower | Loan Amount |
|---|---|---|---|
| Open | Harding Ramsey Pamela S | $86,102 | |
| Closed | Harding Ramsey Pamela S | $63,288 |
Source: Public Records
Tax History
| Year | Tax Paid | Tax Assessment Tax Assessment Total Assessment is a certain percentage of the fair market value that is determined by local assessors to be the total taxable value of land and additions on the property. | Land | Improvement |
|---|---|---|---|---|
| 2025 | $766 | $28,090 | $2,410 | $25,680 |
| 2024 | $766 | $28,090 | $2,410 | $25,680 |
| 2023 | $763 | $28,090 | $2,410 | $25,680 |
| 2022 | $1,002 | $19,970 | $2,190 | $17,780 |
| 2021 | $1,015 | $19,970 | $2,190 | $17,780 |
| 2020 | $973 | $19,970 | $2,190 | $17,780 |
| 2019 | $836 | $16,150 | $2,310 | $13,840 |
| 2018 | $839 | $16,150 | $2,310 | $13,840 |
| 2017 | $815 | $16,150 | $2,310 | $13,840 |
| 2016 | $819 | $15,470 | $2,310 | $13,160 |
| 2015 | $821 | $15,470 | $2,310 | $13,160 |
| 2014 | $786 | $15,470 | $2,310 | $13,160 |
Source: Public Records
Map
Nearby Homes
Your Personal Tour Guide
Ask me questions while you tour the home.