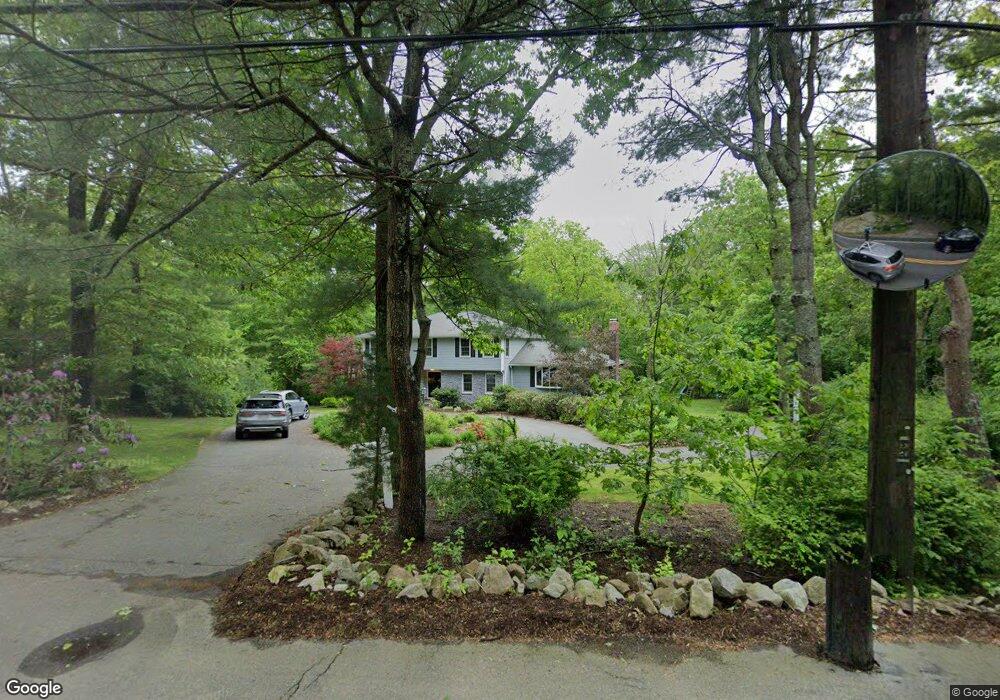
687 Gay St Westwood, MA 02090
Estimated Value: $1,652,000 - $2,006,000
4
Beds
4
Baths
2,778
Sq Ft
$668/Sq Ft
Est. Value
About This Home
This home is located at 687 Gay St, Westwood, MA 02090 and is currently estimated at $1,854,517, approximately $667 per square foot. 687 Gay St is a home located in Norfolk County with nearby schools including Westwood High School, Dedham Country Day School, and Xaverian Brothers High School.
Ownership History
Date
Name
Owned For
Owner Type
Purchase Details
Closed on
Apr 11, 2013
Sold by
Burek Mitchell J and Burek Kathleen G
Bought by
687 Gay Street Nt and Burek Mitchell J
Current Estimated Value
Purchase Details
Closed on
Aug 18, 1995
Sold by
Nasisi Frank and Nasisi Myrna P
Bought by
Burek Mitchell J and Burek Kathleeng
Home Financials for this Owner
Home Financials are based on the most recent Mortgage that was taken out on this home.
Original Mortgage
$240,000
Interest Rate
7.61%
Mortgage Type
Purchase Money Mortgage
Create a Home Valuation Report for This Property
The Home Valuation Report is an in-depth analysis detailing your home's value as well as a comparison with similar homes in the area
Home Values in the Area
Average Home Value in this Area
Purchase History
| Date | Buyer | Sale Price | Title Company |
|---|---|---|---|
| 687 Gay Street Nt | -- | -- | |
| Burek Mitchell J | $350,000 | -- |
Source: Public Records
Mortgage History
| Date | Status | Borrower | Loan Amount |
|---|---|---|---|
| Previous Owner | Burek Mitchell J | $100,000 | |
| Previous Owner | Burek Mitchell J | $240,000 | |
| Previous Owner | Burek Mitchell J | $113,000 |
Source: Public Records
Tax History Compared to Growth
Tax History
| Year | Tax Paid | Tax Assessment Tax Assessment Total Assessment is a certain percentage of the fair market value that is determined by local assessors to be the total taxable value of land and additions on the property. | Land | Improvement |
|---|---|---|---|---|
| 2025 | $21,784 | $1,701,900 | $1,029,600 | $672,300 |
| 2024 | $21,240 | $1,658,100 | $980,000 | $678,100 |
| 2023 | $18,982 | $1,327,400 | $816,800 | $510,600 |
| 2022 | $16,502 | $1,112,750 | $628,000 | $484,750 |
| 2021 | $16,445 | $1,112,650 | $597,600 | $515,050 |
| 2020 | $15,896 | $1,095,550 | $597,600 | $497,950 |
| 2019 | $15,213 | $1,038,450 | $569,600 | $468,850 |
| 2018 | $15,193 | $1,006,850 | $569,600 | $437,250 |
| 2017 | $14,229 | $976,600 | $569,600 | $407,000 |
| 2016 | $13,985 | $953,950 | $569,600 | $384,350 |
| 2015 | $13,644 | $895,300 | $569,600 | $325,700 |
Source: Public Records
Map
Nearby Homes
- 130 Cobleigh St
- 50 Fairview St
- 102 Parker St
- 298 Washington St Unit 302
- 39 Westbrook Ln
- 1 Laura Ln
- 1000 Washington St Unit 205
- 401 Sandy Valley Rd
- 290 East St
- 102 Smith Dr
- 8 Karen Pines St
- 132 Thatcher St
- 306 Highland St
- 17 Royal Ct
- 223 Robert Rd
- 66 Crestwood Cir
- 618 Nahatan St
- 365 Washington St Unit 5
- 165 Highland St Unit 165
- 324 Central Ave