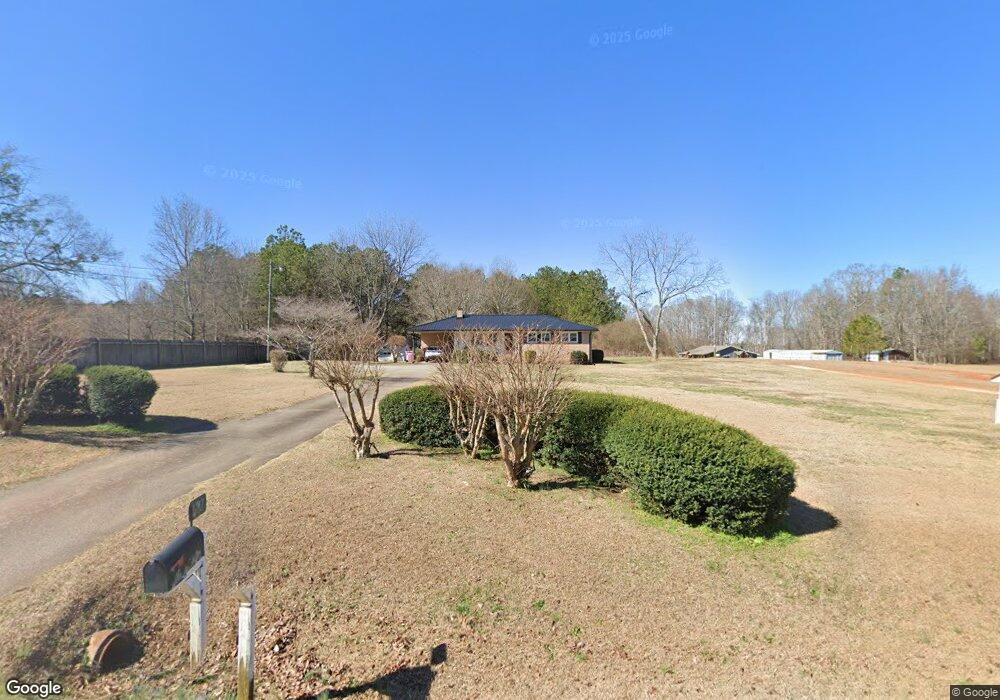
687 Jack Sharp Rd Colbert, GA 30628
Estimated Value: $207,624 - $336,000
Studio
2
Baths
1,315
Sq Ft
$202/Sq Ft
Est. Value
About This Home
This home is located at 687 Jack Sharp Rd, Colbert, GA 30628 and is currently estimated at $265,906, approximately $202 per square foot. 687 Jack Sharp Rd is a home located in Madison County with nearby schools including Madison County High School.
Ownership History
Date
Name
Owned For
Owner Type
Purchase Details
Closed on
Aug 27, 2025
Sold by
Stalnaker Judith Diane
Bought by
Stalnaker Jimmy Lee
Current Estimated Value
Purchase Details
Closed on
Jan 1, 1994
Bought by
Stalnaker Jimmy and Stalnaker Ju
Create a Home Valuation Report for This Property
The Home Valuation Report is an in-depth analysis detailing your home's value as well as a comparison with similar homes in the area
Purchase History
| Date | Buyer | Sale Price | Title Company |
|---|---|---|---|
| Stalnaker Jimmy Lee | -- | -- | |
| Stalnaker Jimmy | -- | -- |
Source: Public Records
Tax History
| Year | Tax Paid | Tax Assessment Tax Assessment Total Assessment is a certain percentage of the fair market value that is determined by local assessors to be the total taxable value of land and additions on the property. | Land | Improvement |
|---|---|---|---|---|
| 2025 | $1,023 | $58,268 | $13,840 | $44,428 |
| 2024 | $10 | $56,817 | $13,840 | $42,977 |
| 2023 | $1,577 | $51,650 | $11,534 | $40,116 |
| 2022 | $695 | $43,205 | $7,931 | $35,274 |
| 2021 | $520 | $35,042 | $7,930 | $27,112 |
| 2020 | $734 | $33,889 | $6,778 | $27,111 |
| 2019 | $724 | $33,298 | $6,778 | $26,520 |
| 2018 | $687 | $32,025 | $6,201 | $25,824 |
| 2017 | $955 | $33,181 | $5,767 | $27,414 |
| 2016 | $749 | $28,089 | $5,246 | $22,844 |
| 2015 | $749 | $28,089 | $5,246 | $22,844 |
| 2014 | $760 | $28,320 | $5,430 | $22,890 |
| 2013 | -- | $28,320 | $5,430 | $22,890 |
Source: Public Records
Map
Nearby Homes
- 142 Rolling Woods Ln Unit 29
- 142 Rolling Woods Ln
- 8576 Highway 72 W
- 1330 McCannon-morris Rd
- 489 Childers Rd
- 487 Childers Rd
- 1618 McCannon Morris Rd
- 722 Charlie Morris Rd
- 75 Madison Ave
- 2206 Lem Edwards Rd
- 259 Watson Dr
- 105 Watson Dr
- 2596 Hardman Morris Rd
- 360 Joe Graham Rd
- 210 Joe Graham Rd
- 1175 Diamond Hill Colbert Rd
- 1080 Spratlin Mill Dr
- 151 Rolling Woods Ln
- 31 Rolling Woods Ln
- 120 Grace Ln Unit 6
- 663 Jack Sharp Rd
- 631 Jack Sharp Rd Unit A
- 631 Jack Sharp Rd
- 682 Jack Sharp Rd
- 707 Jack Sharp Rd
- 609 Jack Sharp Rd
- none Jack Sharp Rd
- 686 Jack Sharp Rd
- 758 Jack Sharp Rd
- 703 Jack Sharp Rd
- 820 Jack Sharp Rd
- 199 Morrison Ln
- 156 Morrison Ln
- 459 Jack Sharp Rd
- 7936 Highway 72 W
- 606 Jack Sharp Rd
- 0 John Sharp Rd
- 287 Morrison Ln
- 111 John Sharp Rd
- 86 Honeysuckle Rd
Your Personal Tour Guide
Ask me questions while you tour the home.