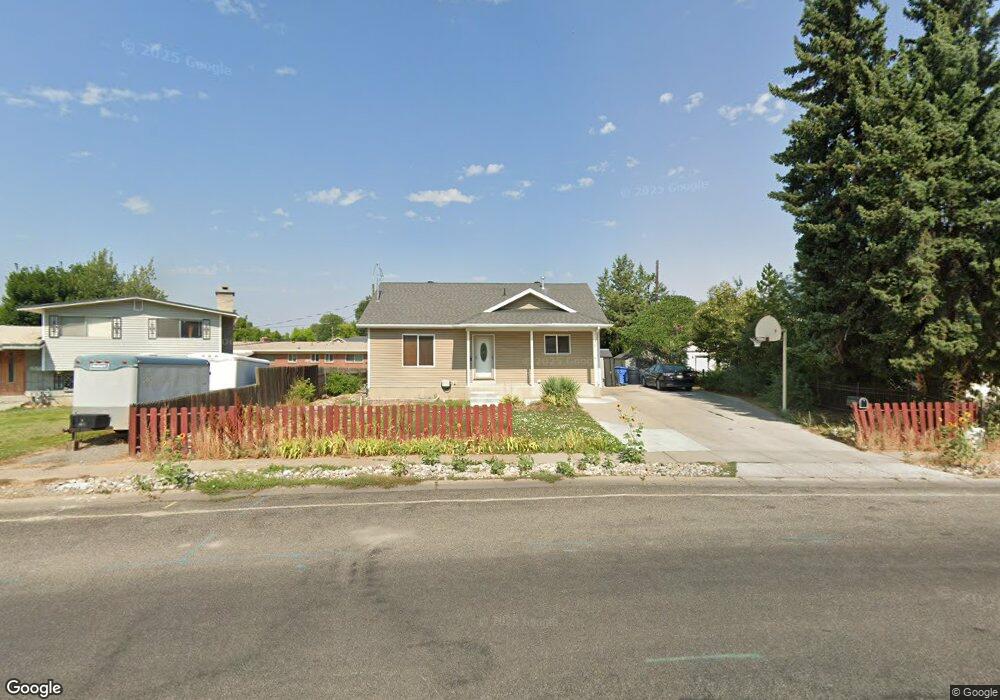
687 N 100 W Logan, UT 84321
Bridger NeighborhoodEstimated Value: $392,000 - $409,000
4
Beds
2
Baths
2,304
Sq Ft
$174/Sq Ft
Est. Value
About This Home
This home is located at 687 N 100 W, Logan, UT 84321 and is currently estimated at $400,607, approximately $173 per square foot. 687 N 100 W is a home located in Cache County with nearby schools including Bridger School, Mount Logan Middle School, and Logan High School.
Ownership History
Date
Name
Owned For
Owner Type
Purchase Details
Closed on
Jun 3, 2025
Sold by
Martin Ryan T
Bought by
Martin Ryan T and Martin Emma
Current Estimated Value
Purchase Details
Closed on
Jan 8, 2021
Sold by
Ward David Charles and Ward Greta Marie
Bought by
Martin Ryan T
Home Financials for this Owner
Home Financials are based on the most recent Mortgage that was taken out on this home.
Original Mortgage
$271,600
Interest Rate
2.71%
Mortgage Type
New Conventional
Purchase Details
Closed on
Mar 23, 2007
Sold by
Habitat For Humanity Cache Valley
Bought by
Ward David Charles and Ward Greta Marie
Home Financials for this Owner
Home Financials are based on the most recent Mortgage that was taken out on this home.
Original Mortgage
$105,360
Interest Rate
6.31%
Mortgage Type
Seller Take Back
Purchase Details
Closed on
Feb 8, 2006
Sold by
Wimmer Wayne W and Wimmer Joann S
Bought by
Habitat For Humanity Cache Valley
Create a Home Valuation Report for This Property
The Home Valuation Report is an in-depth analysis detailing your home's value as well as a comparison with similar homes in the area
Home Values in the Area
Average Home Value in this Area
Purchase History
| Date | Buyer | Sale Price | Title Company |
|---|---|---|---|
| Martin Ryan T | -- | Cache Title | |
| Martin Ryan T | -- | Advanced Title | |
| Ward David Charles | -- | Cache Title Company | |
| Habitat For Humanity Cache Valley | -- | Cache Title Company |
Source: Public Records
Mortgage History
| Date | Status | Borrower | Loan Amount |
|---|---|---|---|
| Previous Owner | Martin Ryan T | $271,600 | |
| Previous Owner | Ward David Charles | $105,360 |
Source: Public Records
Tax History Compared to Growth
Tax History
| Year | Tax Paid | Tax Assessment Tax Assessment Total Assessment is a certain percentage of the fair market value that is determined by local assessors to be the total taxable value of land and additions on the property. | Land | Improvement |
|---|---|---|---|---|
| 2025 | $1,755 | $226,930 | $0 | $0 |
| 2024 | $1,812 | $226,930 | $0 | $0 |
| 2023 | $1,890 | $225,720 | $0 | $0 |
| 2022 | $1,704 | $189,970 | $0 | $0 |
| 2021 | $142 | $244,884 | $45,000 | $199,884 |
| 2020 | $1,411 | $218,813 | $45,000 | $173,813 |
| 2019 | $1,475 | $218,812 | $45,000 | $173,812 |
| 2018 | $1,478 | $200,190 | $45,000 | $155,190 |
| 2017 | $1,404 | $100,540 | $0 | $0 |
| 2016 | $1,456 | $73,850 | $0 | $0 |
| 2015 | $1,071 | $73,850 | $0 | $0 |
| 2014 | $968 | $73,850 | $0 | $0 |
| 2013 | -- | $73,850 | $0 | $0 |
Source: Public Records
Map
Nearby Homes