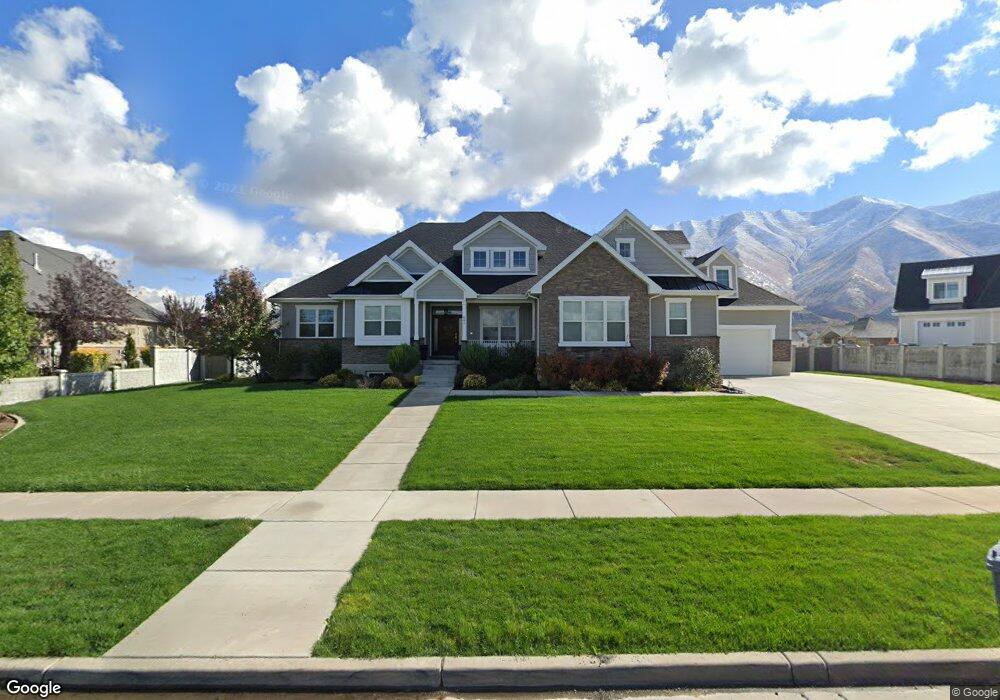
687 S 1200 W Unit 3 Mapleton, UT 84664
Estimated Value: $1,542,000 - $1,764,000
5
Beds
6
Baths
3,131
Sq Ft
$532/Sq Ft
Est. Value
About This Home
This home is located at 687 S 1200 W Unit 3, Mapleton, UT 84664 and is currently estimated at $1,666,092, approximately $532 per square foot. 687 S 1200 W Unit 3 is a home located in Utah County with nearby schools including Mapleton School, Mapleton Junior High School, and Maple Mountain High School.
Ownership History
Date
Name
Owned For
Owner Type
Purchase Details
Closed on
Aug 4, 2011
Sold by
Central Bank
Bought by
Bird Derick H and Bird Tammy
Current Estimated Value
Purchase Details
Closed on
Nov 24, 2009
Sold by
Denos Kenneth I
Bought by
Central Bank
Purchase Details
Closed on
Mar 26, 2007
Sold by
Shenk Joe
Bought by
The Highlands At South Pointe Llc
Home Financials for this Owner
Home Financials are based on the most recent Mortgage that was taken out on this home.
Original Mortgage
$161,735
Interest Rate
6.31%
Mortgage Type
Purchase Money Mortgage
Purchase Details
Closed on
May 2, 2006
Sold by
Stone Mountain Development Llc
Bought by
Shenk Joe
Home Financials for this Owner
Home Financials are based on the most recent Mortgage that was taken out on this home.
Original Mortgage
$147,000
Interest Rate
6.46%
Mortgage Type
Purchase Money Mortgage
Create a Home Valuation Report for This Property
The Home Valuation Report is an in-depth analysis detailing your home's value as well as a comparison with similar homes in the area
Home Values in the Area
Average Home Value in this Area
Purchase History
| Date | Buyer | Sale Price | Title Company |
|---|---|---|---|
| Bird Derick H | -- | Morgan Title & Escrow Inc | |
| Central Bank | $130,000 | None Available | |
| The Highlands At South Pointe Llc | -- | Meridian Title Company | |
| Shenk Joe | -- | Wasatch Land & Title |
Source: Public Records
Mortgage History
| Date | Status | Borrower | Loan Amount |
|---|---|---|---|
| Previous Owner | The Highlands At South Pointe Llc | $161,735 | |
| Previous Owner | Shenk Joe | $147,000 |
Source: Public Records
Tax History
| Year | Tax Paid | Tax Assessment Tax Assessment Total Assessment is a certain percentage of the fair market value that is determined by local assessors to be the total taxable value of land and additions on the property. | Land | Improvement |
|---|---|---|---|---|
| 2025 | $6,805 | $770,605 | -- | -- |
| 2024 | $6,805 | $666,600 | $0 | $0 |
| 2023 | $6,855 | $675,785 | $0 | $0 |
| 2022 | $7,885 | $768,625 | $0 | $0 |
| 2021 | $6,834 | $1,022,800 | $271,200 | $751,600 |
| 2020 | $6,650 | $962,700 | $240,000 | $722,700 |
| 2019 | $4,575 | $676,000 | $240,000 | $436,000 |
| 2018 | $4,040 | $568,300 | $205,000 | $363,300 |
| 2017 | $3,727 | $278,245 | $0 | $0 |
| 2016 | $3,259 | $241,835 | $0 | $0 |
| 2015 | $3,130 | $230,835 | $0 | $0 |
| 2014 | $3,064 | $221,925 | $0 | $0 |
Source: Public Records
Map
Nearby Homes
- 415 S 1200 W
- 896 W 675 S
- 1352 W 900 S
- 715 W 4600 S Unit Lot I101
- 715 W 4600 S Unit Lot I303
- 715 W 4600 S Unit Lot I304
- 1158 S 980 W
- 4664 S 680 W Unit S204
- 4664 S 680 W Unit S203
- 4664 S 680 W Unit S302
- 4664 S 680 W Unit S303
- 4664 S 680 W Unit S201
- 4664 S 680 W Unit S202
- 4664 S 680 W Unit S304
- 4664 S 680 W Unit S301
- 4664 S 680 W Unit S102
- 4664 S 680 W Unit S101
- 1656 W 300 S Unit B
- 1655 W 200 S Unit A
- 509 W 350 S Unit 30
- 687 S 1200 W
- 723 S 1200 W
- 723 S 1200 W Unit 2
- 643 S 1200 W
- 643 S 1200 W Unit 4
- 765 S 1200 W
- 765 S 1200 W Unit 1
- 1164 W 800 St S
- 599 S 1200 W
- 599 S 1200 W Unit 5
- 662 S 1200 W
- 662 S 1200 W Unit 10
- 624 S 1200 W Unit 9
- 1218 W 800 S Unit 12
- 1218 W 800 S Unit 11
- 1218 W 1218 W 800 S
- 1068 W 800 S
- 555 S 1200 W
- 555 S 1200 W Unit 6
- 1242 W 800 S Unit 12
Your Personal Tour Guide
Ask me questions while you tour the home.