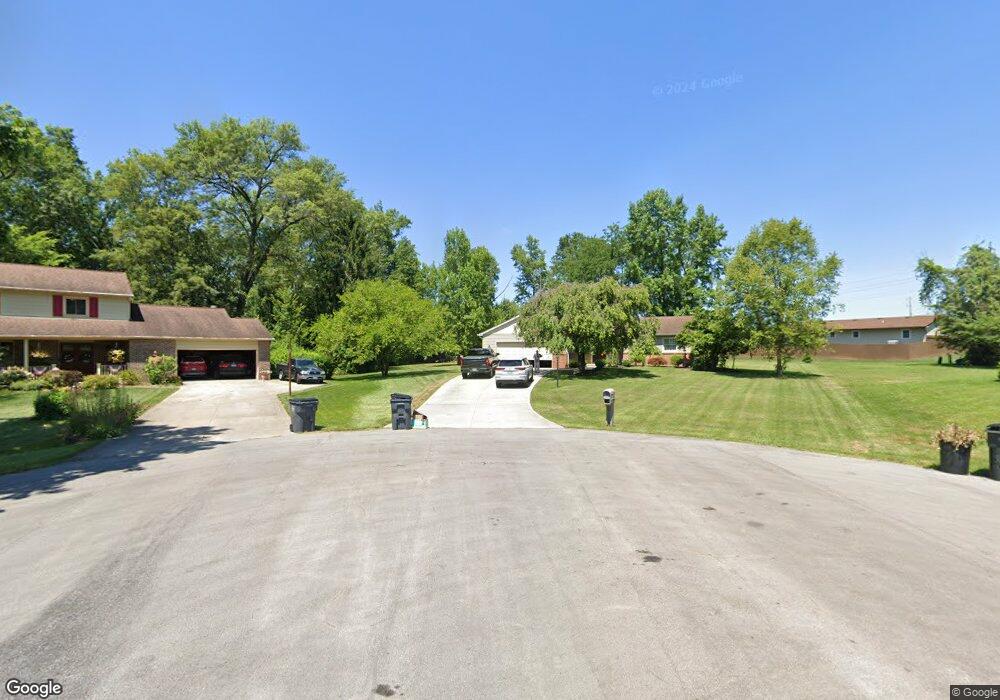
6870 Ridgeway Ct NW Pickerington, OH 43147
Estimated Value: $375,000 - $451,097
4
Beds
5
Baths
2,466
Sq Ft
$170/Sq Ft
Est. Value
About This Home
This home is located at 6870 Ridgeway Ct NW, Pickerington, OH 43147 and is currently estimated at $418,524, approximately $169 per square foot. 6870 Ridgeway Ct NW is a home located in Fairfield County with nearby schools including Toll Gate Elementary School, Toll Gate Middle School, and Pickerington Lakeview Junior High School.
Ownership History
Date
Name
Owned For
Owner Type
Purchase Details
Closed on
Oct 18, 2021
Sold by
Parsley Rodney L and The Roman Revocable Trust
Bought by
Pokhrel Dev and Basnet Sumitra
Current Estimated Value
Home Financials for this Owner
Home Financials are based on the most recent Mortgage that was taken out on this home.
Original Mortgage
$275,823
Interest Rate
2.88%
Mortgage Type
New Conventional
Purchase Details
Closed on
Dec 21, 2015
Sold by
Stimmel Gary
Bought by
The Roman Revocable Trust
Purchase Details
Closed on
Aug 5, 2015
Sold by
Us Bank Trust Na
Bought by
Stimmel Gary
Purchase Details
Closed on
Jul 15, 2015
Sold by
Campbell Robert M and Campbell Roxanne L
Bought by
Us Bank Trust Na
Purchase Details
Closed on
Mar 1, 1989
Bought by
Campbell Robert M
Create a Home Valuation Report for This Property
The Home Valuation Report is an in-depth analysis detailing your home's value as well as a comparison with similar homes in the area
Home Values in the Area
Average Home Value in this Area
Purchase History
| Date | Buyer | Sale Price | Title Company |
|---|---|---|---|
| Pokhrel Dev | $355,900 | Northwest Select Ttl Agcy Ll | |
| The Roman Revocable Trust | $209,900 | None Available | |
| Stimmel Gary | $111,000 | Allodial Title Llc | |
| Us Bank Trust Na | $124,000 | Attorney | |
| Campbell Robert M | $83,000 | -- |
Source: Public Records
Mortgage History
| Date | Status | Borrower | Loan Amount |
|---|---|---|---|
| Previous Owner | Pokhrel Dev | $275,823 |
Source: Public Records
Tax History Compared to Growth
Tax History
| Year | Tax Paid | Tax Assessment Tax Assessment Total Assessment is a certain percentage of the fair market value that is determined by local assessors to be the total taxable value of land and additions on the property. | Land | Improvement |
|---|---|---|---|---|
| 2024 | $11,916 | $100,560 | $22,360 | $78,200 |
| 2023 | $4,575 | $100,560 | $22,360 | $78,200 |
| 2022 | $4,589 | $100,560 | $22,360 | $78,200 |
| 2021 | $3,967 | $72,280 | $18,800 | $53,480 |
| 2020 | $3,984 | $72,280 | $18,800 | $53,480 |
| 2019 | $4,036 | $72,280 | $18,800 | $53,480 |
| 2018 | $3,810 | $53,240 | $18,800 | $34,440 |
| 2017 | $3,820 | $59,640 | $18,920 | $40,720 |
| 2016 | $3,800 | $59,640 | $18,920 | $40,720 |
| 2015 | $2,814 | $52,630 | $17,200 | $35,430 |
| 2014 | $2,778 | $52,630 | $17,200 | $35,430 |
| 2013 | $2,778 | $52,630 | $17,200 | $35,430 |
Source: Public Records
Map
Nearby Homes
- 11867 Kennington Square W
- 7031 Sanctuary NW
- 12234 Tybee NW
- 12157 Tybee NW
- 12186 Tybee NW
- 12235 Tybee Ct NW
- 12150 Tybee Ct NW
- 7044 Sanctuary Dr NW
- Worthington Plan at Heron Crossing
- Fremont Plan at Heron Crossing
- Dearborn Plan at Heron Crossing
- Madison Plan at Heron Crossing
- Findlay Plan at Heron Crossing
- Hudson Plan at Heron Crossing
- Evanston Plan at Heron Crossing
- Riverside Plan at Heron Crossing
- Granville Plan at Heron Crossing
- 12253 Tybee Ct NW
- 12146 Prairie View NW
- 12181 Prairie View Dr NW
- 6870 Ridgeway Ct
- 6860 Ridgeway Ct
- 6860 Ridgeway Ct NW
- 6865 Ridgeway Ct
- 6905 Refugee Rd
- 6885 Refugee Rd
- 6855 Ridgeway Ct
- 6915 Refugee Rd
- 6850 Ridgeway Ct
- 6855 Refugee Rd
- 6845 Ridgeway Ct
- 11860 Shadybrook Ct
- 6840 Ridgeway Ct
- 6835 Ridgeway Ct
- 11870 Shadybrook Ct
- 6825 Refugee Rd
- 11870 Shadybrook Dr NW
- 6830 Ridgeway Ct
- 11850 Shadybrook Ct
- 11850 Shadybrook Ct NW