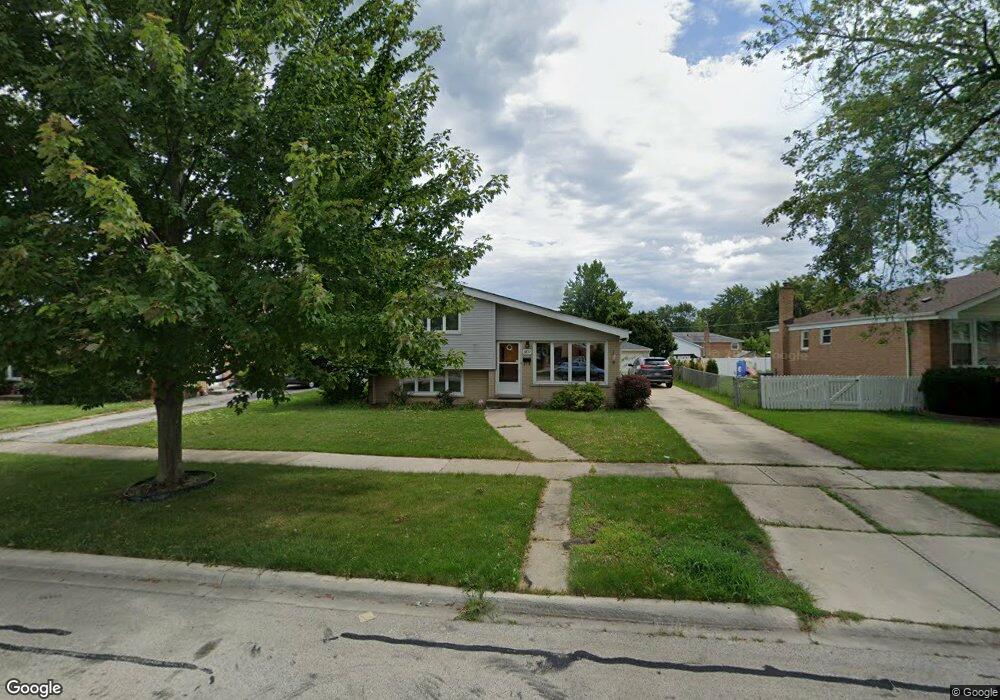
6871 176th Place Tinley Park, IL 60477
Barrett Brothers Familyland NeighborhoodEstimated Value: $272,000 - $347,000
3
Beds
1
Bath
1,168
Sq Ft
$266/Sq Ft
Est. Value
About This Home
This home is located at 6871 176th Place, Tinley Park, IL 60477 and is currently estimated at $310,294, approximately $265 per square foot. 6871 176th Place is a home located in Cook County with nearby schools including Memorial Elementary School, Central Middle School, and Tinley Park High School.
Ownership History
Date
Name
Owned For
Owner Type
Purchase Details
Closed on
Feb 10, 2009
Sold by
Holup Craig and Holup Charles
Bought by
Carls Place Llc
Current Estimated Value
Purchase Details
Closed on
Dec 16, 2008
Sold by
Morris Thomas and Morris Karen
Bought by
Holup Craig and Holup April
Purchase Details
Closed on
Nov 6, 1998
Sold by
Morris Karen M and Aardsma Karen M
Bought by
Morris Thomas L and Morris Karen M
Home Financials for this Owner
Home Financials are based on the most recent Mortgage that was taken out on this home.
Original Mortgage
$32,200
Interest Rate
6.68%
Purchase Details
Closed on
Aug 10, 1994
Sold by
Aardsma Walter L and Aardsma Karen M
Bought by
Aardsma Karen M
Home Financials for this Owner
Home Financials are based on the most recent Mortgage that was taken out on this home.
Original Mortgage
$76,000
Interest Rate
8.73%
Create a Home Valuation Report for This Property
The Home Valuation Report is an in-depth analysis detailing your home's value as well as a comparison with similar homes in the area
Home Values in the Area
Average Home Value in this Area
Purchase History
| Date | Buyer | Sale Price | Title Company |
|---|---|---|---|
| Carls Place Llc | -- | None Available | |
| Holup Craig | $181,000 | None Available | |
| Morris Thomas L | -- | -- | |
| Aardsma Karen M | -- | -- |
Source: Public Records
Mortgage History
| Date | Status | Borrower | Loan Amount |
|---|---|---|---|
| Previous Owner | Morris Thomas L | $32,200 | |
| Previous Owner | Aardsma Karen M | $76,000 |
Source: Public Records
Tax History Compared to Growth
Tax History
| Year | Tax Paid | Tax Assessment Tax Assessment Total Assessment is a certain percentage of the fair market value that is determined by local assessors to be the total taxable value of land and additions on the property. | Land | Improvement |
|---|---|---|---|---|
| 2024 | $7,376 | $25,000 | $4,389 | $20,611 |
| 2023 | $6,760 | $25,000 | $4,389 | $20,611 |
| 2022 | $6,760 | $19,291 | $3,791 | $15,500 |
| 2021 | $6,728 | $19,290 | $3,790 | $15,500 |
| 2020 | $6,772 | $19,290 | $3,790 | $15,500 |
| 2019 | $6,901 | $19,819 | $3,391 | $16,428 |
| 2018 | $6,827 | $19,819 | $3,391 | $16,428 |
| 2017 | $6,897 | $19,819 | $3,391 | $16,428 |
| 2016 | $6,753 | $18,103 | $2,992 | $15,111 |
| 2015 | $6,568 | $18,103 | $2,992 | $15,111 |
| 2014 | $6,519 | $18,103 | $2,992 | $15,111 |
| 2013 | $6,031 | $18,376 | $2,992 | $15,384 |
Source: Public Records
Map
Nearby Homes
- 17700 70th Ct
- 17707 71st Ave
- 16724 Oak Park Ave
- 6839 179th St
- 17436 71st Ave
- 17377 71st Ave
- 6807 180th Ct
- 00 LOT 180th St
- 17713 66th Ave
- 18001 S Harlem Ave
- 6715 180th St Unit 5
- 17951 66th Ct
- 17223 69th Ave
- 17842 65th Ave
- 17900 65th Ave
- 6448 175th St
- 7278 173rd Place
- 18145 Harlem Ave
- 6520 173rd Place
- 7120 182nd St
- 6865 176th Place
- 6877 176th Place
- 6859 176th Place
- 6901 176th Place
- 6870 177th St
- 6876 177th St
- 6864 177th St
- 6900 177th St
- 6858 177th St
- 6907 176th Place
- 6853 176th Place
- 6870 176th Place
- 6876 176th Place
- 6864 176th Place
- 6906 177th St
- 6852 177th St
- 6858 176th Place
- 6900 176th Place
- 6913 176th Place
- 6847 176th Place