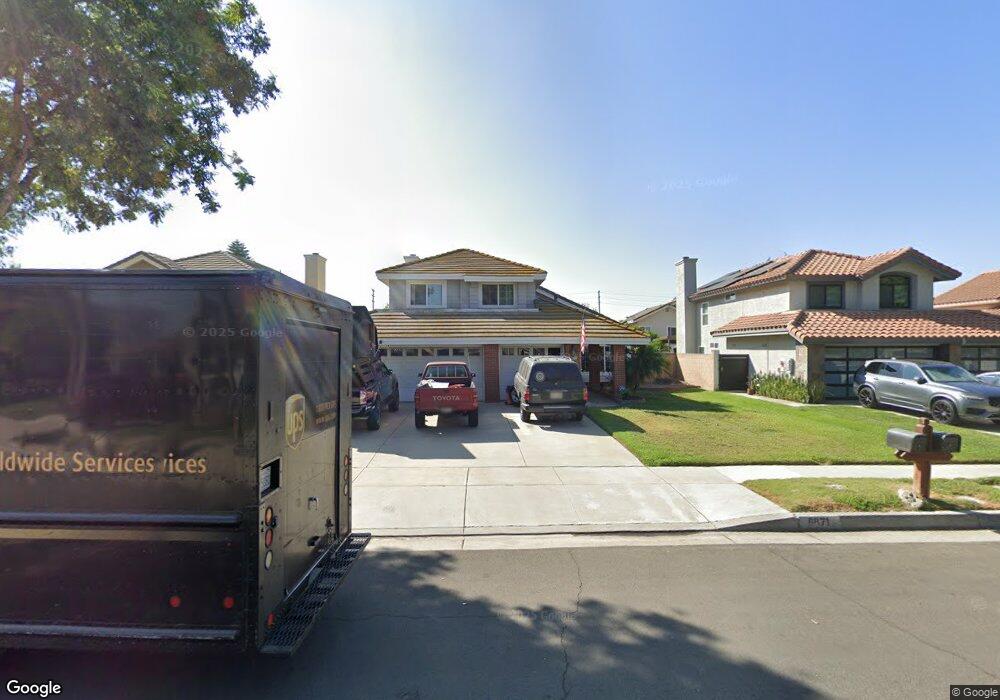
6871 Stone Pine Ct Chino, CA 91710
Chino AreaEstimated Value: $812,000 - $944,000
About This Home
This home is located at 6871 Stone Pine Ct, Chino, CA 91710 and is currently estimated at $861,284, approximately $443 per square foot. 6871 Stone Pine Ct is a home located in San Bernardino County with nearby schools including Edwin Rhodes Elementary, Magnolia Junior High, and Chino High School.
Ownership History
We collect this data history from publicly available records. To have your information removed, we recommend requesting removal directly through your county’s website.
Purchase Details
Home Financials for this Owner
Home Financials are based on the most recent Mortgage that was taken out on this home.Purchase Details
Home Financials for this Owner
Home Financials are based on the most recent Mortgage that was taken out on this home.Purchase Details
Home Financials for this Owner
Home Financials are based on the most recent Mortgage that was taken out on this home.Purchase Details
Home Financials for this Owner
Home Financials are based on the most recent Mortgage that was taken out on this home.Purchase Details
Home Financials for this Owner
Home Financials are based on the most recent Mortgage that was taken out on this home.Purchase Details
Home Financials for this Owner
Home Financials are based on the most recent Mortgage that was taken out on this home.Purchase Details
Home Values in the Area
Average Home Value in this Area
Purchase History
We collect this data history from publicly available records. To have your information removed, we recommend requesting removal directly through your county’s website.
| Date | Buyer | Sale Price | Title Company |
|---|---|---|---|
| -- | Orange Coast Title Company | ||
| -- | Equity Title Company | ||
| $364,000 | Equity Title Company | ||
| -- | First Southwestern | ||
| $485,000 | First Southwestern | ||
| $252,000 | Gateway Title Company | ||
| $182,000 | Northern Counties Title |
Mortgage History
We collect this data history from publicly available records. To have your information removed, we recommend requesting removal directly through your county’s website.
| Date | Status | Borrower | Loan Amount |
|---|---|---|---|
| Open | $45,517 | ||
| Open | $230,000 | ||
| Closed | $246,000 | ||
| Closed | $244,000 | ||
| Previous Owner | $150,000 | ||
| Previous Owner | $385,000 | ||
| Previous Owner | $233,400 |
Tax History
We collect this data history from publicly available records. To have your information removed, we recommend requesting removal directly through your county’s website.
| Year | Tax Paid | Tax Assessment Tax Assessment Total Assessment is a certain percentage of the fair market value that is determined by local assessors to be the total taxable value of land and additions on the property. | Land | Improvement |
|---|---|---|---|---|
| 2026 | $5,547 | $491,196 | $171,886 | $319,310 |
| 2025 | $5,547 | $481,565 | $168,516 | $313,049 |
| 2024 | $5,404 | $472,123 | $165,212 | $306,911 |
| 2023 | $5,260 | $462,866 | $161,973 | $300,893 |
| 2022 | $5,230 | $453,790 | $158,797 | $294,993 |
| 2021 | $5,131 | $444,892 | $155,683 | $289,209 |
| 2020 | $5,067 | $440,331 | $154,087 | $286,244 |
| 2019 | $4,982 | $431,697 | $151,066 | $280,631 |
| 2018 | $4,876 | $423,232 | $148,104 | $275,128 |
| 2017 | $4,792 | $414,933 | $145,200 | $269,733 |
| 2016 | $4,489 | $406,797 | $142,353 | $264,444 |
| 2015 | $4,403 | $400,687 | $140,215 | $260,472 |
| 2014 | $4,319 | $392,838 | $137,468 | $255,370 |
Map
- 6860 Stone Pine Ct
- 6767 Star Pine Ct
- 6641 Sugar Pine Ct
- 13798 Live Oak Ave
- 6576 Darcena St
- 14350 Saint Michaels Ln
- 6956 La Rochelle Way
- 14170 Durazno Ave
- 6744 Joy Ct
- 6845 Lunt St
- 13569 Goldmedal Ave
- 14349 Guilford Ave
- 14561 Baylor Ave
- 14554 Rochester Ave
- 6609 Angelina Ct
- 14572 Purdue Ave
- 14587 Baylor Ave
- 7013 Vanderbilt St Unit 53
- 14571 Longwood Ave
- 14591 Westfield Ave
- 6863 Stone Pine Ct
- 6879 Stone Pine Ct
- 6874 Sugar Pine Ct
- 6855 Stone Pine Ct
- 6866 Sugar Pine Ct
- 6887 Stone Pine Ct
- 6882 Sugar Pine Ct
- 6858 Sugar Pine Ct
- 6847 Stone Pine Ct
- 6876 Stone Pine Ct
- 6868 Stone Pine Ct
- 6884 Stone Pine Ct
- 6850 Sugar Pine Ct
- 6892 Stone Pine Ct
- 6890 Sugar Pine Ct
- 6852 Stone Pine Ct
- 6839 Stone Pine Ct
- 6842 Sugar Pine Ct
- 6844 Stone Pine Ct
- 6867 Sugar Pine Ct
Ask me questions while you tour the home.