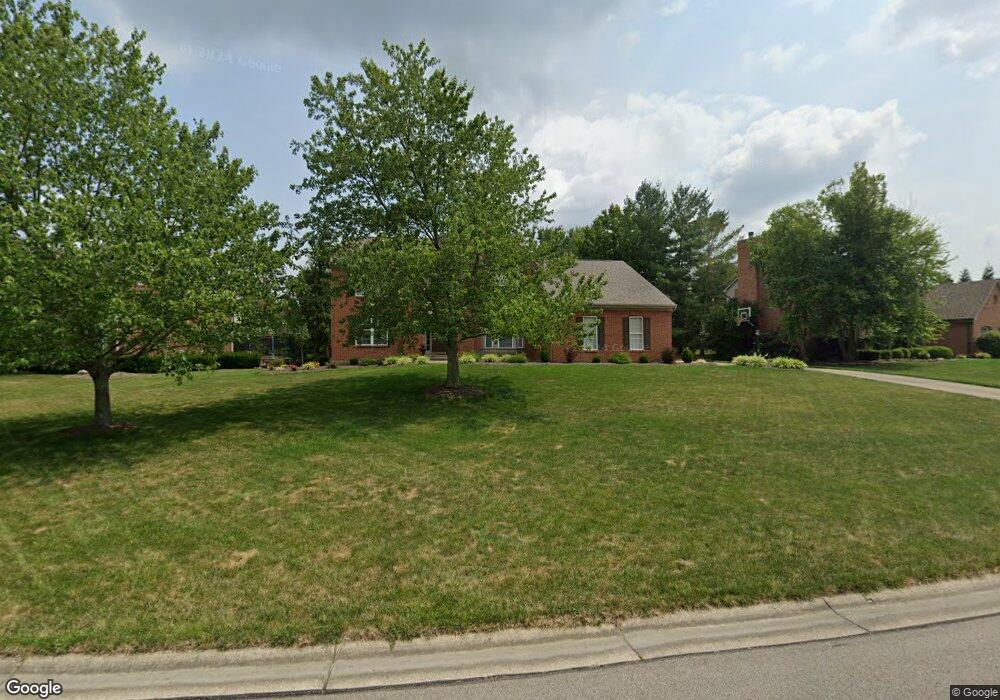
6874 Obannon Bluff Loveland, OH 45140
Estimated Value: $623,154 - $692,000
5
Beds
4
Baths
2,696
Sq Ft
$245/Sq Ft
Est. Value
About This Home
This home is located at 6874 Obannon Bluff, Loveland, OH 45140 and is currently estimated at $659,789, approximately $244 per square foot. 6874 Obannon Bluff is a home located in Clermont County with nearby schools including Loveland Primary School, Loveland Elementary School, and Loveland Intermediate School.
Ownership History
Date
Name
Owned For
Owner Type
Purchase Details
Closed on
May 22, 2009
Sold by
Bullock Jason S and Bullock Stefanie A
Bought by
Saemann Michael R and Saemann Michelle D
Current Estimated Value
Purchase Details
Closed on
Jul 20, 2005
Sold by
Lyle Scott B and Lyle Janeen A
Bought by
Bullock Jason S and Bullock Stefanie A
Home Financials for this Owner
Home Financials are based on the most recent Mortgage that was taken out on this home.
Original Mortgage
$46,700
Interest Rate
5.71%
Mortgage Type
Credit Line Revolving
Purchase Details
Closed on
Apr 24, 1998
Sold by
Zicka Homes Inc
Bought by
Lyle Janeen A and Lyle Scott B
Home Financials for this Owner
Home Financials are based on the most recent Mortgage that was taken out on this home.
Original Mortgage
$223,150
Interest Rate
7.26%
Mortgage Type
New Conventional
Create a Home Valuation Report for This Property
The Home Valuation Report is an in-depth analysis detailing your home's value as well as a comparison with similar homes in the area
Home Values in the Area
Average Home Value in this Area
Purchase History
| Date | Buyer | Sale Price | Title Company |
|---|---|---|---|
| Saemann Michael R | $341,500 | Attorney | |
| Bullock Jason S | $358,500 | -- | |
| Lyle Janeen A | $278,979 | -- |
Source: Public Records
Mortgage History
| Date | Status | Borrower | Loan Amount |
|---|---|---|---|
| Previous Owner | Bullock Jason S | $46,700 | |
| Previous Owner | Bullock Jason S | $286,800 | |
| Previous Owner | Lyle Janeen A | $223,150 |
Source: Public Records
Tax History Compared to Growth
Tax History
| Year | Tax Paid | Tax Assessment Tax Assessment Total Assessment is a certain percentage of the fair market value that is determined by local assessors to be the total taxable value of land and additions on the property. | Land | Improvement |
|---|---|---|---|---|
| 2024 | $8,849 | $161,500 | $38,540 | $122,960 |
| 2023 | $8,722 | $161,500 | $38,540 | $122,960 |
| 2022 | $7,373 | $113,020 | $26,950 | $86,070 |
| 2021 | $7,384 | $113,020 | $26,950 | $86,070 |
| 2020 | $7,037 | $113,020 | $26,950 | $86,070 |
| 2019 | $6,727 | $101,010 | $26,740 | $74,270 |
| 2018 | $6,607 | $101,010 | $26,740 | $74,270 |
| 2017 | $6,787 | $101,010 | $26,740 | $74,270 |
| 2016 | $6,893 | $97,130 | $25,730 | $71,400 |
| 2015 | $6,427 | $97,130 | $25,730 | $71,400 |
| 2014 | $6,427 | $97,130 | $25,730 | $71,400 |
| 2013 | $5,674 | $95,980 | $25,730 | $70,250 |
Source: Public Records
Map
Nearby Homes
- 6853 Obannon Bluff
- 6875 Stonehedge Cir
- 6874 Clubside Dr
- 6646 Gentlewind Ct
- 1277 Sand Trap Ct
- 1487 Sawgrass Ridge Dr
- 6805 N Clarawill Dr
- 6661 Gentlewind Ct
- Vaquero Plan at Stone Pillars
- Lexington Plan at Stone Pillars
- 1383 Stone Pillars Ct Unit Lot10
- 6647 Saddleback Way
- 6650 Saddleback Way
- 6651 Saddleback Way
- 6651 Saddleback Way Unit Lot13
- 100 Colonial Dr
- 9197 Lawnview Ct
- 1209 Red Roan Dr
- 4039 Oakland Hills Dr
- 101 Founders Dr
- 6872 Obannon Bluff
- 6876 Obannon Bluff
- 1215 Obannon Creek Ln
- 1214 Silvercreek Cir
- 1211 Obannon Creek Ln
- 6875 Obannon Bluff
- 6877 Obannon Bluff
- 1217 Obannon Creek Ln
- 6873 Obannon Bluff
- 6871 Obannon Bluff
- 1218 Obannon Creek Ln
- 1209 Obannon Creek Ln
- 1218 Silvercreek Cir
- 1219 Obannon Creek Ln
- 6869 Obannon Bluff
- 1220 Obannon Creek Ln
- 6864 Obannon Bluff
- 1207 Obannon Creek Ln
- 1217 Silvercreek Cir
- 1220 Silvercreek Cir