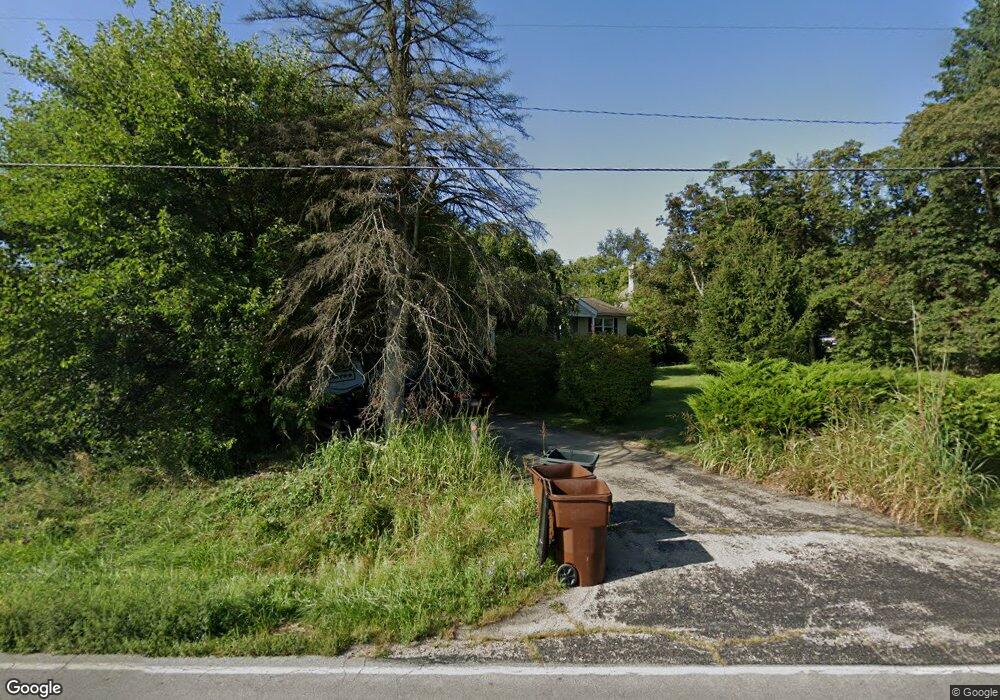
6875 Lithopolis Rd Carroll, OH 43112
Bloom NeighborhoodEstimated Value: $371,000 - $423,000
3
Beds
2
Baths
2,184
Sq Ft
$180/Sq Ft
Est. Value
About This Home
This home is located at 6875 Lithopolis Rd, Carroll, OH 43112 and is currently estimated at $394,201, approximately $180 per square foot. 6875 Lithopolis Rd is a home located in Fairfield County with nearby schools including Bloom Carroll Primary School, Bloom Carroll Intermediate School, and Bloom-Carroll Middle School.
Ownership History
Date
Name
Owned For
Owner Type
Purchase Details
Closed on
Apr 1, 2009
Sold by
National Residential Nominee Services In
Bought by
Roach Timothy N and Roach Shana N
Current Estimated Value
Home Financials for this Owner
Home Financials are based on the most recent Mortgage that was taken out on this home.
Original Mortgage
$173,757
Interest Rate
4.85%
Mortgage Type
VA
Purchase Details
Closed on
Jan 14, 2008
Sold by
Pinkerman Christopher A
Bought by
National Residential Nominee Svcs Inc
Purchase Details
Closed on
Jun 3, 2004
Sold by
Pinkerman Leigh Ann
Bought by
Pinkerman Christopher A
Home Financials for this Owner
Home Financials are based on the most recent Mortgage that was taken out on this home.
Original Mortgage
$157,000
Interest Rate
6.06%
Mortgage Type
New Conventional
Purchase Details
Closed on
Jun 29, 1993
Sold by
Eschbaugh Charles
Bought by
Pinkerman Christopher A
Purchase Details
Closed on
May 1, 1989
Create a Home Valuation Report for This Property
The Home Valuation Report is an in-depth analysis detailing your home's value as well as a comparison with similar homes in the area
Home Values in the Area
Average Home Value in this Area
Purchase History
| Date | Buyer | Sale Price | Title Company |
|---|---|---|---|
| Roach Timothy N | $170,100 | Fidelity | |
| National Residential Nominee Svcs Inc | $162,000 | Attorney | |
| Pinkerman Christopher A | -- | -- | |
| Pinkerman Christopher A | $109,000 | -- | |
| -- | $88,900 | -- |
Source: Public Records
Mortgage History
| Date | Status | Borrower | Loan Amount |
|---|---|---|---|
| Previous Owner | Roach Timothy N | $173,757 | |
| Previous Owner | Pinkerman Christopher A | $157,000 |
Source: Public Records
Tax History
| Year | Tax Paid | Tax Assessment Tax Assessment Total Assessment is a certain percentage of the fair market value that is determined by local assessors to be the total taxable value of land and additions on the property. | Land | Improvement |
|---|---|---|---|---|
| 2025 | $7,880 | $106,370 | $33,250 | $73,120 |
| 2024 | $7,880 | $95,630 | $21,870 | $73,760 |
| 2023 | $4,048 | $95,630 | $21,870 | $73,760 |
| 2022 | $4,079 | $95,630 | $21,870 | $73,760 |
| 2021 | $3,230 | $68,450 | $17,500 | $50,950 |
| 2020 | $3,265 | $68,450 | $17,500 | $50,950 |
| 2019 | $3,275 | $68,450 | $17,500 | $50,950 |
| 2018 | $3,091 | $53,840 | $14,700 | $39,140 |
| 2017 | $2,913 | $65,370 | $14,000 | $51,370 |
| 2016 | $2,869 | $65,370 | $14,000 | $51,370 |
| 2015 | $2,742 | $60,730 | $14,000 | $46,730 |
| 2014 | $2,630 | $60,730 | $14,000 | $46,730 |
| 2013 | $2,630 | $60,730 | $14,000 | $46,730 |
Source: Public Records
Map
Nearby Homes
- 7195 Alspach Rd NW
- 5715 Coonpath Rd NW
- 3510 Kauffman Rd NW
- 3540 Carroll-Southern Rd NW
- 4400 Kauffman Rd NW
- 7835 E Ohio State Ln NW
- 2155 Carroll-Southern Rd NW
- 55 Betz Rd SW
- 6920 Winchester Rd NW
- 7545 Royalton Rd SW
- 8322 Benson Rd
- 10 Mount Zion Rd NW
- 50 Market St
- 52 W Canal St
- 8667 Mount Union Ct NW
- 8158 Brittany Dr NW
- 8642 Water St
- 681 Mount Zion Rd SW
- 3355 Old Columbus Rd NW
- 8245 Royalton Rd SW
- 0001 Lithopolis Rd
- 6889 Lithopolis Rd
- 6889 Lithopolis Rd NW
- 6905 Lithopolis Rd
- 6915 Lithopolis Rd
- 6915 Lithopolis Rd NW
- 6931 Lithopolis Rd
- 6931 NW Lithopolis Rd
- 6939 Lithopolis Rd
- 6947 Lithopolis Rd
- 6995 Lithopolis Rd
- 7015 Lithopolis Rd
- 7039 Lithopolis Rd
- 7040 Lithopolis Rd
- 7040 Lithopolis Rd
- 7135 Lithopolis Rd
- 7095 Lithopolis Rd NW
- 7030 Lithopolis Rd
- 6590 Lithopolis Rd NW
- 7130 Lithopolis Rd NW
Your Personal Tour Guide
Ask me questions while you tour the home.