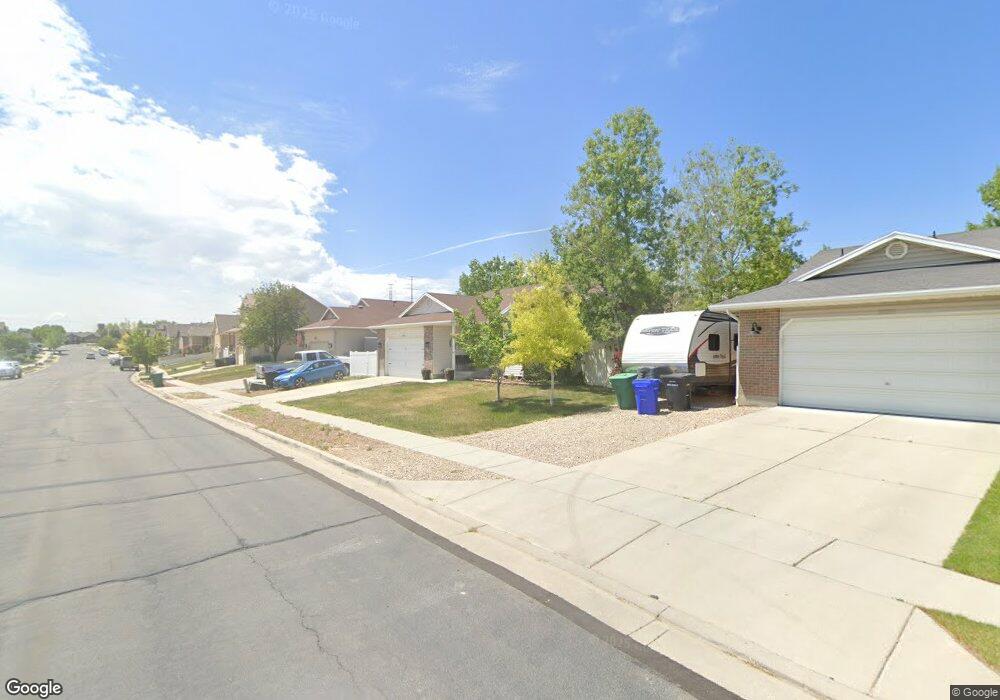
6876 Adventure Way West Jordan, UT 84081
Oquirrh NeighborhoodEstimated Value: $500,000 - $536,887
3
Beds
2
Baths
1,297
Sq Ft
$398/Sq Ft
Est. Value
About This Home
This home is located at 6876 Adventure Way, West Jordan, UT 84081 and is currently estimated at $516,222, approximately $398 per square foot. 6876 Adventure Way is a home located in Salt Lake County with nearby schools including Falcon Ridge School, Sunset Ridge Middle School, and Copper Hills High School.
Ownership History
Date
Name
Owned For
Owner Type
Purchase Details
Closed on
Mar 8, 2013
Sold by
Case Heather
Bought by
Case Heather A
Current Estimated Value
Home Financials for this Owner
Home Financials are based on the most recent Mortgage that was taken out on this home.
Original Mortgage
$185,600
Outstanding Balance
$130,676
Interest Rate
3.49%
Mortgage Type
New Conventional
Estimated Equity
$385,546
Purchase Details
Closed on
Apr 26, 2010
Sold by
Case James and Case Heather
Bought by
Case Heather
Purchase Details
Closed on
Oct 5, 2000
Sold by
Midwest Construction Company Inc
Bought by
Case James and Case Heather
Home Financials for this Owner
Home Financials are based on the most recent Mortgage that was taken out on this home.
Original Mortgage
$148,860
Interest Rate
7.96%
Mortgage Type
FHA
Create a Home Valuation Report for This Property
The Home Valuation Report is an in-depth analysis detailing your home's value as well as a comparison with similar homes in the area
Home Values in the Area
Average Home Value in this Area
Purchase History
| Date | Buyer | Sale Price | Title Company |
|---|---|---|---|
| Case Heather A | -- | Backman Title Services | |
| Case Heather | -- | Executive Title Ins Agency | |
| Case James | -- | -- | |
| Midwest Construction Company Inc | -- | -- |
Source: Public Records
Mortgage History
| Date | Status | Borrower | Loan Amount |
|---|---|---|---|
| Open | Case Heather A | $185,600 | |
| Closed | Case James | $148,860 |
Source: Public Records
Tax History Compared to Growth
Tax History
| Year | Tax Paid | Tax Assessment Tax Assessment Total Assessment is a certain percentage of the fair market value that is determined by local assessors to be the total taxable value of land and additions on the property. | Land | Improvement |
|---|---|---|---|---|
| 2025 | $2,714 | $480,300 | $158,400 | $321,900 |
| 2024 | $2,714 | $458,700 | $152,200 | $306,500 |
| 2023 | $2,721 | $432,200 | $146,400 | $285,800 |
| 2022 | $2,866 | $452,400 | $143,600 | $308,800 |
| 2021 | $2,511 | $368,000 | $110,400 | $257,600 |
| 2020 | $2,351 | $321,800 | $102,400 | $219,400 |
| 2019 | $2,295 | $307,300 | $96,600 | $210,700 |
| 2018 | $2,128 | $281,200 | $96,600 | $184,600 |
| 2017 | $2,038 | $265,300 | $96,600 | $168,700 |
| 2016 | $2,098 | $256,900 | $89,400 | $167,500 |
| 2015 | $1,816 | $214,500 | $96,200 | $118,300 |
| 2014 | $1,776 | $206,100 | $93,200 | $112,900 |
Source: Public Records
Map
Nearby Homes
- 6977 W Hidden Way S Unit 147
- 6721 Adventure Way
- 6739 S Sol Rise Dr
- 5732 W Moon Crest Ct
- 7134 S Rialto Way
- 5502 Starflower Way
- 5557 W Joshua Cir
- 6922 Mullien Dr
- 5466 Ticklegrass Rd
- 7758 S Iron Core Ln
- 7146 W Owens View Way Unit 204
- 7259 W Cibola Rd
- 6853 Mullien Dr Unit 5420
- 6116 W Graceland Way
- 6839 S Cyclamen Dr
- 5818 W Whisper View Ct
- 5818 W Whisper View Ct Unit 336
- 7296 S Sophia Ridge Ct
- 6150 W Nellies St
- 5644 W 7340 S
- 6876 Adventure Way Unit lot 25
- 6884 S Adventure Way
- 6884 Adventure Way
- 6866 Adventure Way
- 6866 S Adventure Way
- 6873 S 5785 W
- 6894 S Adventure Way
- 6894 Adventure Way
- 6887 S 5785 W
- 6861 S 5785 W
- 6861 S 5785 W Unit lot 29
- 6852 Adventure Way
- 6852 Adventure Way Unit lot 27
- 6875 S Adventure Way
- 6875 Adventure Way
- 6897 S 5785 W
- 6897 S 5785 W Unit 321
- 6883 S Adventure Way
- 6863 S Adventure Way
- 6883 Adventure Way