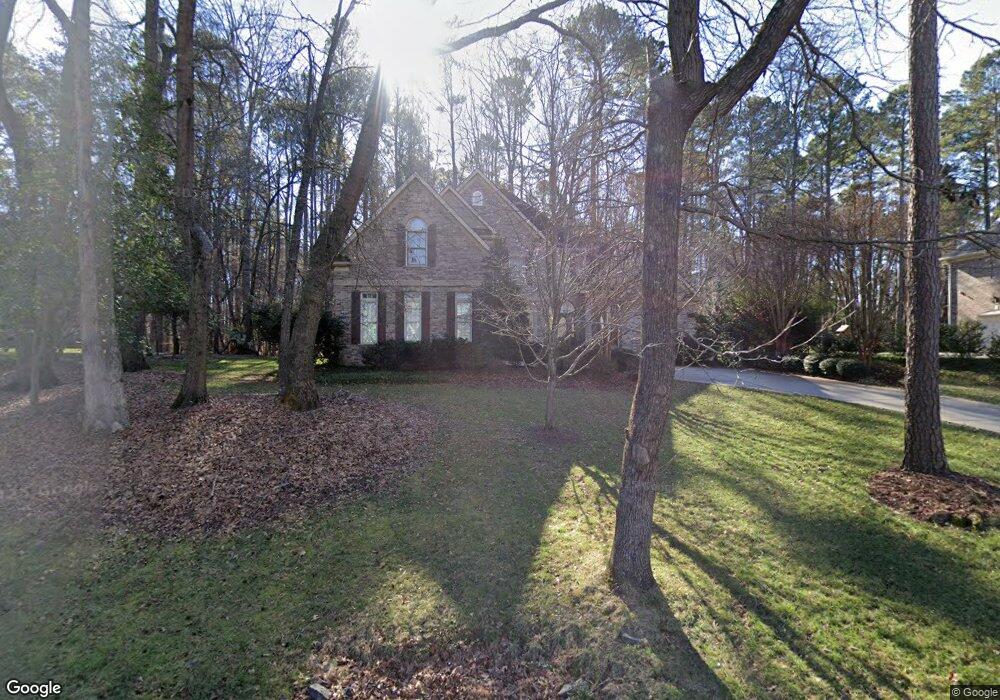
6877 Montgomery Rd Clover, SC 29710
Estimated Value: $876,047 - $1,009,000
4
Beds
4
Baths
3,537
Sq Ft
$274/Sq Ft
Est. Value
About This Home
This home is located at 6877 Montgomery Rd, Clover, SC 29710 and is currently estimated at $970,012, approximately $274 per square foot. 6877 Montgomery Rd is a home located in York County with nearby schools including Oakridge Elementary School, Oakridge Middle School, and Clover High School.
Ownership History
Date
Name
Owned For
Owner Type
Purchase Details
Closed on
Jan 22, 2016
Sold by
Faris Joe S and Faris Karen H
Bought by
Knowlton Phillip and Knowlton Samantha D
Current Estimated Value
Purchase Details
Closed on
Feb 24, 2011
Sold by
Citibank N A
Bought by
Ives Jeremy S and Ives Ann P
Home Financials for this Owner
Home Financials are based on the most recent Mortgage that was taken out on this home.
Original Mortgage
$357,072
Interest Rate
4.76%
Mortgage Type
New Conventional
Purchase Details
Closed on
Aug 11, 2010
Sold by
Desart Jeffrey A and Desart Christyn A
Bought by
Citibank Na
Purchase Details
Closed on
Jun 18, 2007
Sold by
Sage Homes Inc
Bought by
Desart Jeffrey A and Desart Christyn A
Home Financials for this Owner
Home Financials are based on the most recent Mortgage that was taken out on this home.
Original Mortgage
$517,500
Interest Rate
6.67%
Mortgage Type
Adjustable Rate Mortgage/ARM
Create a Home Valuation Report for This Property
The Home Valuation Report is an in-depth analysis detailing your home's value as well as a comparison with similar homes in the area
Home Values in the Area
Average Home Value in this Area
Purchase History
| Date | Buyer | Sale Price | Title Company |
|---|---|---|---|
| Knowlton Phillip | $164,500 | -- | |
| Ives Jeremy S | $390,000 | -- | |
| Citibank Na | $2,500 | -- | |
| Desart Jeffrey A | $575,000 | Attorney |
Source: Public Records
Mortgage History
| Date | Status | Borrower | Loan Amount |
|---|---|---|---|
| Previous Owner | Ives Jeremy S | $357,072 | |
| Previous Owner | Desart Jeffrey A | $517,500 |
Source: Public Records
Tax History Compared to Growth
Tax History
| Year | Tax Paid | Tax Assessment Tax Assessment Total Assessment is a certain percentage of the fair market value that is determined by local assessors to be the total taxable value of land and additions on the property. | Land | Improvement |
|---|---|---|---|---|
| 2024 | $2,743 | $19,412 | $3,265 | $16,147 |
| 2023 | $2,813 | $19,412 | $3,265 | $16,147 |
| 2022 | $2,318 | $19,412 | $3,270 | $16,142 |
| 2021 | -- | $19,412 | $3,270 | $16,142 |
| 2020 | $2,197 | $19,412 | $0 | $0 |
| 2019 | $2,085 | $16,880 | $0 | $0 |
| 2018 | $2,095 | $16,880 | $0 | $0 |
| 2017 | $1,951 | $16,880 | $0 | $0 |
| 2016 | $1,838 | $16,880 | $0 | $0 |
| 2014 | $2,198 | $16,880 | $3,000 | $13,880 |
| 2013 | $2,198 | $19,280 | $3,000 | $16,280 |
Source: Public Records
Map
Nearby Homes
- 6881 Pine Moss Ln
- 6860 Pine Moss Ln Unit 1
- 288 Ridge Reserve Dr
- 386 Squirrel Ln
- 4134 Charlotte Hwy Unit A
- 385 Squirrel Ln
- 345 Squirrel Ln
- 11 Tanglewood Rd
- 329 Squirrel Ln
- 16 Woodvine Ln
- 14043 Queens Harbor Rd
- 14522 Waterside Dr
- 13731 Petworth Ct
- 23 Tanglewood Rd
- 13932 Queens Harbor Rd
- 5088 Watersail Way
- 5130 Watersail Way
- 14617 Waterside Dr
- 13701 Petworth Ct
- 13934 Kings Carriage Ln
- 6887 Montgomery Rd
- 6865 Montgomery Rd Unit 25
- 6865 Montgomery Rd
- Lot 67 Montgomery Rd Unit 67
- 6868 Montgomery Rd
- 6878 Montgomery Rd
- 6878 Montgomery Rd Unit 155
- 6897 Montgomery Rd
- 6860 Montgomery Rd
- 6853 Montgomery Rd
- 6886 Montgomery Rd
- 6911 Montgomery Rd
- 6898 Montgomery Rd
- 7008 Yager Ridge Dr
- 7016 Yager Ridge Dr Unit 69
- 7016 Yager Ridge Dr
- 7109 Montgomery Rd
- 7085 Montgomery Rd Unit 9/Phase 1
- 7097 Montgomery Rd
- 7024 Yager Ridge Dr