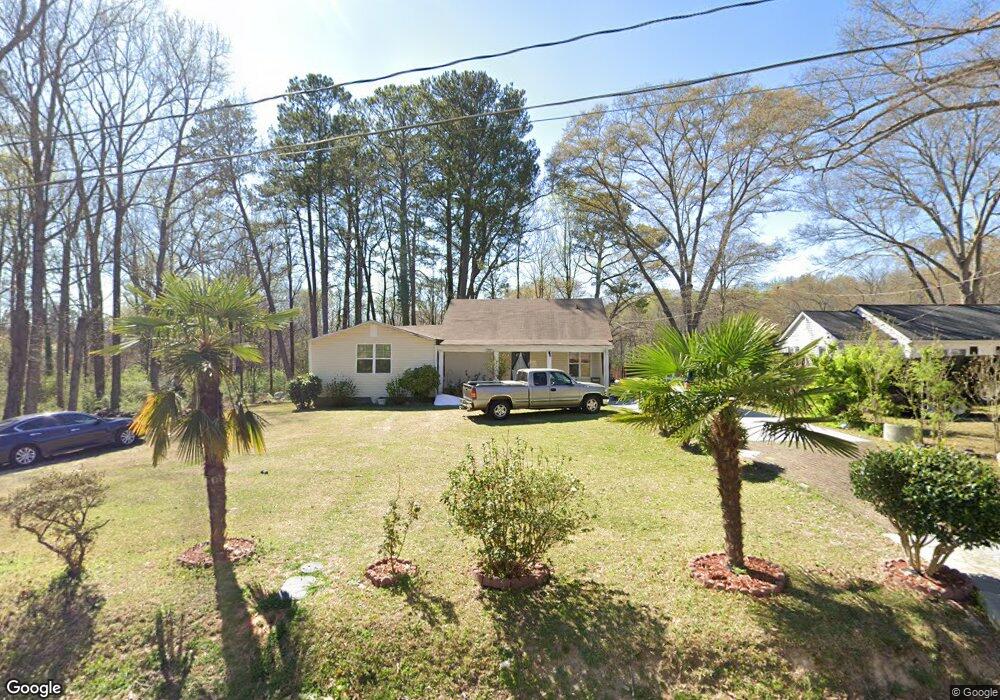
6879 Mark Turner Rd Lithia Springs, GA 30122
Lithia Springs NeighborhoodEstimated Value: $201,000 - $243,000
3
Beds
1
Bath
1,362
Sq Ft
$159/Sq Ft
Est. Value
About This Home
This home is located at 6879 Mark Turner Rd, Lithia Springs, GA 30122 and is currently estimated at $216,569, approximately $159 per square foot. 6879 Mark Turner Rd is a home located in Douglas County with nearby schools including Lithia Springs Elementary School, Turner Middle School, and Lithia Springs Comprehensive High School.
Ownership History
Date
Name
Owned For
Owner Type
Purchase Details
Closed on
Jun 22, 2009
Sold by
Federal Home Loan Mortgage Corporation
Bought by
Roman Mateo
Current Estimated Value
Purchase Details
Closed on
Feb 3, 2009
Sold by
Taylor Bean & Whitaker Mtg Cor
Bought by
Federal Home Loan Mortgage Corporation
Purchase Details
Closed on
Feb 12, 2007
Sold by
Matty Bug Properties Llc
Bought by
Huber Henry J and Huber Carolyn
Home Financials for this Owner
Home Financials are based on the most recent Mortgage that was taken out on this home.
Original Mortgage
$74,900
Interest Rate
7.12%
Mortgage Type
New Conventional
Purchase Details
Closed on
May 26, 2004
Sold by
Thompson Mildred W
Bought by
Caymol Mateo
Home Financials for this Owner
Home Financials are based on the most recent Mortgage that was taken out on this home.
Original Mortgage
$75,000
Interest Rate
5.89%
Create a Home Valuation Report for This Property
The Home Valuation Report is an in-depth analysis detailing your home's value as well as a comparison with similar homes in the area
Home Values in the Area
Average Home Value in this Area
Purchase History
| Date | Buyer | Sale Price | Title Company |
|---|---|---|---|
| Roman Mateo | -- | -- | |
| Federal Home Loan Mortgage Corporation | -- | -- | |
| Taylor Bean & Whitaker Mtg Cor | $59,307 | -- | |
| Huber Henry J | $107,000 | -- | |
| Caymol Mateo | $66,400 | -- |
Source: Public Records
Mortgage History
| Date | Status | Borrower | Loan Amount |
|---|---|---|---|
| Previous Owner | Huber Henry J | $74,900 | |
| Previous Owner | Caymol Mateo | $75,000 |
Source: Public Records
Tax History Compared to Growth
Tax History
| Year | Tax Paid | Tax Assessment Tax Assessment Total Assessment is a certain percentage of the fair market value that is determined by local assessors to be the total taxable value of land and additions on the property. | Land | Improvement |
|---|---|---|---|---|
| 2024 | $1,756 | $55,800 | $12,240 | $43,560 |
| 2023 | $1,756 | $55,800 | $12,240 | $43,560 |
| 2022 | $1,161 | $35,640 | $7,000 | $28,640 |
| 2021 | $946 | $29,000 | $7,000 | $22,000 |
| 2020 | $962 | $29,000 | $7,000 | $22,000 |
| 2019 | $883 | $28,520 | $7,000 | $21,520 |
| 2018 | $859 | $27,600 | $7,000 | $20,600 |
| 2017 | $799 | $25,200 | $7,000 | $18,200 |
| 2016 | $729 | $22,600 | $6,480 | $16,120 |
| 2015 | $692 | $22,160 | $6,480 | $15,680 |
| 2014 | $692 | $20,604 | $6,480 | $14,124 |
| 2013 | -- | $20,564 | $6,480 | $14,084 |
Source: Public Records
Map
Nearby Homes
- 2500 Rosehill Cir
- 0 Miller St Unit 10574225
- 6717 S Sweetwater Rd
- 6069 Wisteria Ln
- 3476 Cooper St
- 7011 S Sweetwater Rd
- 2102 Orchid Ln
- 2081 Orchid Ln
- 545 Paces Dr
- 6660 Maxwell Dr
- 7104 Miller St
- 515 Paces Dr
- 2230 Highridge Point Dr
- 3347 Skyview Dr
- 3340 Skyview Dr
- 480 Paces Dr
- 485 Paces Dr
- 2180 Highridge Point Dr
- 475 Paces Dr
- 6869 Mark Turner Rd
- 6874 Florence Dr
- 6855 Mark Turner Rd
- 6852 Florence Dr
- 6860 Mark Turner Road 0
- 6899 Mark Turner Rd
- 6860 Mark Turner Rd
- 6896 Florence Dr
- 6840 Florence Dr
- 6843 Mark Turner Rd
- 2610 Rosehill Cir
- 2610 Rosehill Cir Unit 2610
- 2610 Rosehill Cir Unit n/a
- 2620 Rosehill Cir
- 2600 Rosehill Cir
- 00 Lithia Way
- 0 Lithia Way Unit 10225192
- 0 Lithia Way Unit 7303533
- 0 Lithia Way Unit 7222969
- 0 Lithia Way Unit 7064069