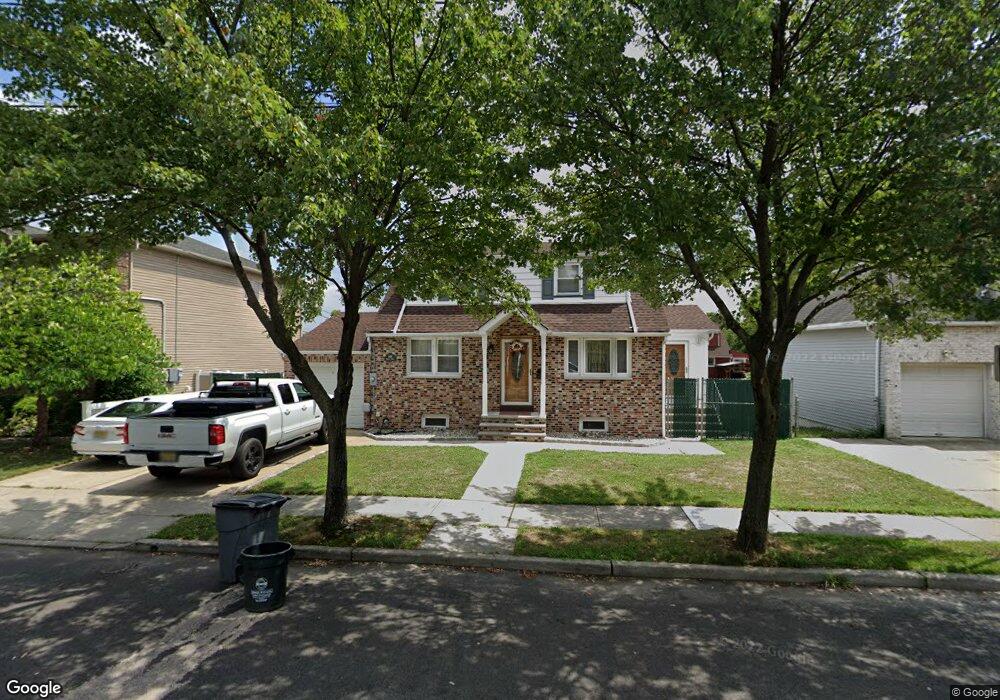
688 2nd St Secaucus, NJ 07094
Estimated Value: $623,951 - $875,000
Studio
--
Bath
1,408
Sq Ft
$516/Sq Ft
Est. Value
About This Home
This home is located at 688 2nd St, Secaucus, NJ 07094 and is currently estimated at $726,738, approximately $516 per square foot. 688 2nd St is a home located in Hudson County with nearby schools including Secaucus High School.
Ownership History
Date
Name
Owned For
Owner Type
Purchase Details
Closed on
Oct 28, 2013
Sold by
Citro Bernard and Citro Filomena
Bought by
Cipriano Nicolo A and Cipriano Pierina
Current Estimated Value
Home Financials for this Owner
Home Financials are based on the most recent Mortgage that was taken out on this home.
Original Mortgage
$300,800
Outstanding Balance
$226,877
Interest Rate
4.52%
Mortgage Type
New Conventional
Estimated Equity
$499,861
Purchase Details
Closed on
Oct 25, 2001
Sold by
Daly Seamus A and Daly Renee
Bought by
Citro Vincent and Citro Filomena
Purchase Details
Closed on
Jun 30, 1999
Sold by
Trygstad Arnold H and Trygstad Ruth E
Bought by
Daly Seamus A
Home Financials for this Owner
Home Financials are based on the most recent Mortgage that was taken out on this home.
Original Mortgage
$142,000
Interest Rate
7.19%
Create a Home Valuation Report for This Property
The Home Valuation Report is an in-depth analysis detailing your home's value as well as a comparison with similar homes in the area
Home Values in the Area
Average Home Value in this Area
Purchase History
| Date | Buyer | Sale Price | Title Company |
|---|---|---|---|
| Cipriano Nicolo A | $376,000 | None Available | |
| Citro Vincent | $312,000 | Ticor Title Insurance Compan | |
| Daly Seamus A | $231,000 | First American Title |
Source: Public Records
Mortgage History
| Date | Status | Borrower | Loan Amount |
|---|---|---|---|
| Open | Cipriano Nicolo A | $300,800 | |
| Previous Owner | Daly Seamus A | $142,000 |
Source: Public Records
Tax History
| Year | Tax Paid | Tax Assessment Tax Assessment Total Assessment is a certain percentage of the fair market value that is determined by local assessors to be the total taxable value of land and additions on the property. | Land | Improvement |
|---|---|---|---|---|
| 2025 | $7,198 | $175,900 | $98,100 | $77,800 |
| 2024 | $6,981 | $175,900 | $98,100 | $77,800 |
| 2023 | $6,981 | $175,900 | $98,100 | $77,800 |
| 2022 | $6,619 | $175,900 | $98,100 | $77,800 |
| 2021 | $6,631 | $175,900 | $98,100 | $77,800 |
| 2020 | $6,572 | $175,900 | $98,100 | $77,800 |
| 2019 | $6,529 | $175,900 | $98,100 | $77,800 |
| 2018 | $6,350 | $175,900 | $98,100 | $77,800 |
| 2017 | $6,357 | $175,900 | $98,100 | $77,800 |
| 2016 | $6,521 | $175,900 | $98,100 | $77,800 |
| 2015 | $6,512 | $175,900 | $98,100 | $77,800 |
| 2014 | $6,624 | $175,900 | $98,100 | $77,800 |
Source: Public Records
Map
Nearby Homes
- 718 1st St
- 6 Walter Place
- 229 Centre Ave
- 672 Chestnut Place
- 10 Raydol Ave
- 761 4th St Unit B
- 761 4th St
- 761 4th St Unit A
- 781 2nd St
- 728 Irving Place
- 720 Hudson Ave
- 329 Centre Ave
- 774 8th St
- 842 7th St
- 827 Hudson Ave
- 840 Roosevelt Ave
- 2 Radio Ave Unit C12
- 24 Marina Key Unit 24
- 16 Marina Key Unit 16
- 40 Valley Ct
Your Personal Tour Guide
Ask me questions while you tour the home.