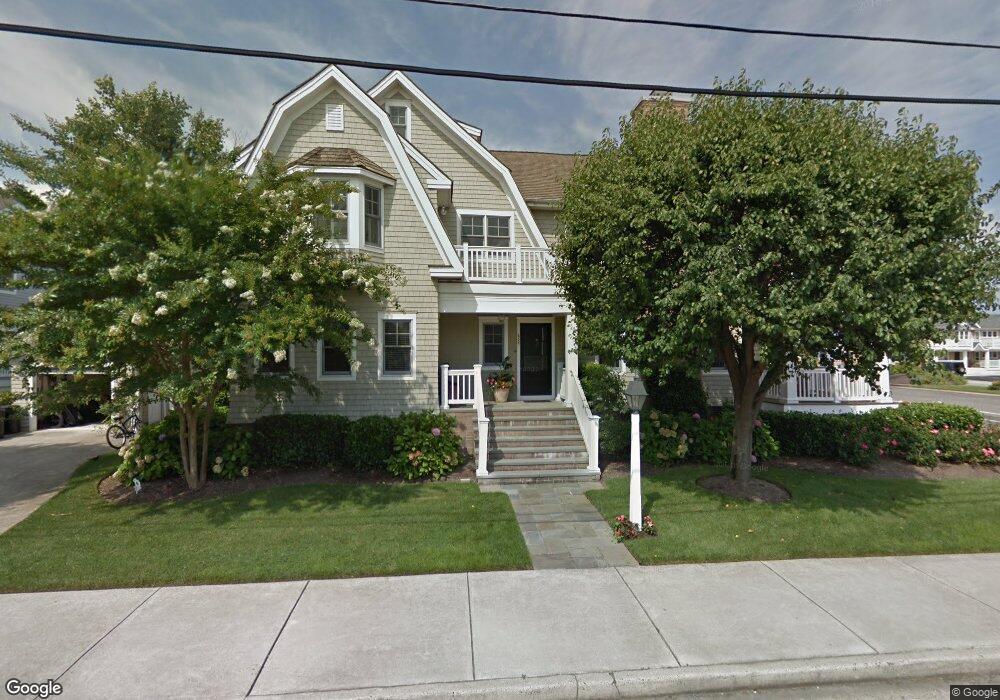
688 Dune Dr Avalon, NJ 08202
Estimated Value: $3,810,000 - $5,054,000
Studio
--
Bath
3,979
Sq Ft
$1,128/Sq Ft
Est. Value
About This Home
This home is located at 688 Dune Dr, Avalon, NJ 08202 and is currently estimated at $4,487,402, approximately $1,127 per square foot. 688 Dune Dr is a home located in Cape May County with nearby schools including Avalon Elementary School.
Ownership History
Date
Name
Owned For
Owner Type
Purchase Details
Closed on
Dec 10, 2024
Sold by
Graham Stephen P and Graham Nancy E
Bought by
Revocable Agreement Of Trust and Graham
Current Estimated Value
Purchase Details
Closed on
Apr 24, 2002
Sold by
Lambert John
Bought by
Graham Stephen P and Graham Nancy E
Purchase Details
Closed on
Apr 22, 2000
Sold by
Harvey's Port Of Call
Bought by
Byrne Margaret H
Purchase Details
Closed on
Dec 22, 1989
Sold by
Lambert John and Lambert Theresa
Bought by
Lambert John
Create a Home Valuation Report for This Property
The Home Valuation Report is an in-depth analysis detailing your home's value as well as a comparison with similar homes in the area
Home Values in the Area
Average Home Value in this Area
Purchase History
We collect this data history from publicly available records. To have your information removed, we recommend requesting removal directly through your county’s website.
| Date | Buyer | Sale Price | Title Company |
|---|---|---|---|
| Revocable Agreement Of Trust | -- | None Listed On Document | |
| Revocable Agreement Of Trust | -- | None Listed On Document | |
| Revocable Agreement Of Trust | -- | None Listed On Document | |
| Graham Stephen P | $675,000 | -- | |
| Byrne Margaret H | $500,000 | -- | |
| Byrne Margaret H | $500,000 | -- | |
| Lambert John | -- | -- |
Source: Public Records
Tax History
| Year | Tax Paid | Tax Assessment Tax Assessment Total Assessment is a certain percentage of the fair market value that is determined by local assessors to be the total taxable value of land and additions on the property. | Land | Improvement |
|---|---|---|---|---|
| 2025 | $13,590 | $2,213,300 | $1,215,000 | $998,300 |
| 2024 | $13,590 | $2,213,300 | $1,215,000 | $998,300 |
| 2023 | $13,479 | $2,213,300 | $1,215,000 | $998,300 |
| 2022 | $12,572 | $2,213,300 | $1,215,000 | $998,300 |
| 2021 | $12,107 | $2,213,300 | $1,215,000 | $998,300 |
| 2020 | $11,642 | $2,213,300 | $1,215,000 | $998,300 |
| 2019 | $11,288 | $2,213,300 | $1,215,000 | $998,300 |
| 2018 | $10,801 | $2,213,300 | $1,215,000 | $998,300 |
| 2017 | $11,447 | $2,058,800 | $1,146,300 | $912,500 |
| 2016 | $11,323 | $2,058,800 | $1,146,300 | $912,500 |
| 2015 | $11,138 | $2,058,800 | $1,146,300 | $912,500 |
| 2014 | $11,015 | $2,058,800 | $1,146,300 | $912,500 |
Source: Public Records
Map
Nearby Homes
Your Personal Tour Guide
Ask me questions while you tour the home.