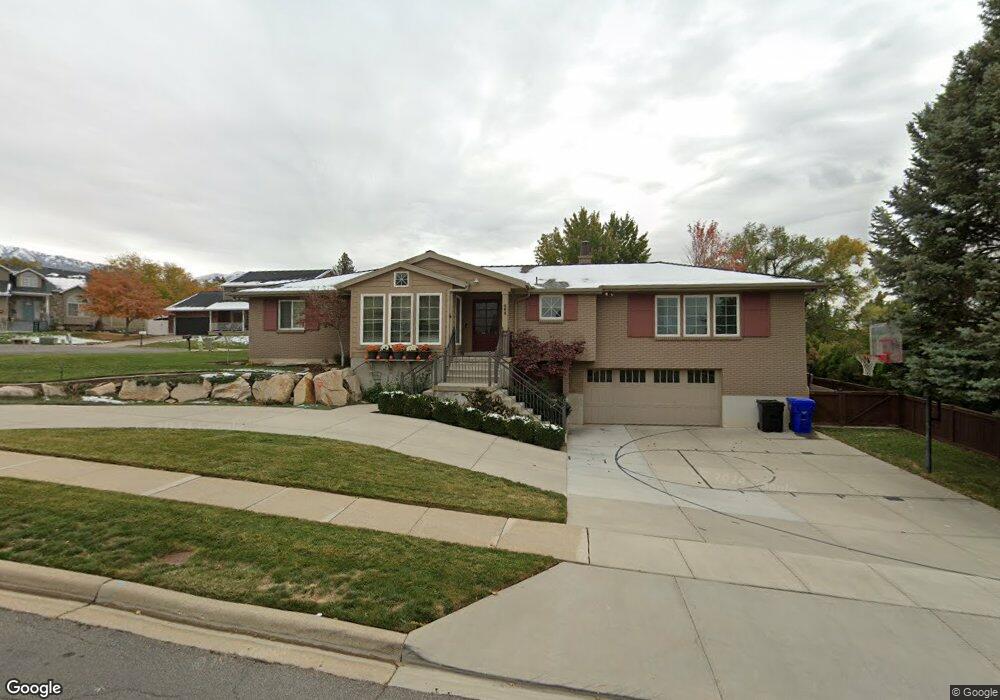
688 E 200 S Bountiful, UT 84010
Estimated Value: $652,000 - $717,000
4
Beds
4
Baths
2,087
Sq Ft
$322/Sq Ft
Est. Value
About This Home
This home is located at 688 E 200 S, Bountiful, UT 84010 and is currently estimated at $671,485, approximately $321 per square foot. 688 E 200 S is a home located in Davis County with nearby schools including Holbrook Elementary School, Millcreek Junior High School, and Bountiful High School.
Ownership History
Date
Name
Owned For
Owner Type
Purchase Details
Closed on
May 25, 2023
Sold by
Johnson Gary G
Bought by
Johnson Family Trust
Current Estimated Value
Purchase Details
Closed on
Sep 22, 2010
Sold by
Johnson Gary G and Johnson Camille D
Bought by
Johnson Gary G and Johnson Camille D
Home Financials for this Owner
Home Financials are based on the most recent Mortgage that was taken out on this home.
Original Mortgage
$130,600
Interest Rate
3.85%
Mortgage Type
New Conventional
Purchase Details
Closed on
Oct 19, 2004
Sold by
Tovey Larene and Sanford Darryl
Bought by
Johnson Gary G and Price Camille
Purchase Details
Closed on
Oct 27, 1999
Sold by
Sanford Wayne U
Bought by
Sanford Wayne U
Create a Home Valuation Report for This Property
The Home Valuation Report is an in-depth analysis detailing your home's value as well as a comparison with similar homes in the area
Purchase History
| Date | Buyer | Sale Price | Title Company |
|---|---|---|---|
| Johnson Family Trust | -- | None Listed On Document | |
| Johnson Gary G | -- | Us Title Company Of Utah | |
| Johnson Gary G | -- | Bonneville Title Company Inc | |
| Johnson Gary G | -- | Bonneville Title Company Inc | |
| Johnson Gary G | -- | Bonneville Title Company Inc | |
| Johnson Gary G | -- | Bonneville Title Company Inc | |
| Johnson Gary G | -- | Bonneville Title Company Inc | |
| Johnson Gary G | -- | Bonneville Title Company Inc | |
| Sanford Wayne U | -- | -- |
Source: Public Records
Mortgage History
| Date | Status | Borrower | Loan Amount |
|---|---|---|---|
| Previous Owner | Johnson Gary G | $130,600 |
Source: Public Records
Tax History
| Year | Tax Paid | Tax Assessment Tax Assessment Total Assessment is a certain percentage of the fair market value that is determined by local assessors to be the total taxable value of land and additions on the property. | Land | Improvement |
|---|---|---|---|---|
| 2025 | $3,990 | $367,950 | $129,515 | $238,435 |
| 2024 | $3,733 | $355,300 | $119,376 | $235,924 |
| 2023 | $3,609 | $623,000 | $216,924 | $406,076 |
| 2022 | $3,704 | $350,900 | $115,576 | $235,324 |
| 2021 | $3,313 | $480,000 | $171,819 | $308,181 |
| 2020 | $2,916 | $424,000 | $156,441 | $267,559 |
| 2019 | $2,876 | $408,000 | $153,051 | $254,949 |
| 2018 | $2,686 | $375,000 | $142,318 | $232,682 |
| 2016 | $2,249 | $169,675 | $45,872 | $123,803 |
| 2015 | $2,262 | $161,370 | $45,872 | $115,498 |
| 2014 | $2,138 | $156,418 | $45,872 | $110,546 |
| 2013 | -- | $147,396 | $49,115 | $98,281 |
Source: Public Records
Map
Nearby Homes
- 698 E 200 S
- 6 N 800 E
- 683 E 100 N
- 129 N 800 E
- 456 E 500 S
- 520 S Orchard Dr Unit 17
- 275 E Peach Ln S
- 255 E 400 S
- 323 Peach Ln
- 1138 Briggs Dr
- 357 S 100 E
- 545 S 100 E
- 453 N 400 E Unit 7-D
- 513 N 400 E Unit 14B
- 861 E Millbrook Way
- 285 E 1100 S
- 49 E 200 N Unit 4
- 55 E 200 N Unit 2
- 41 E 200 N Unit 6
- 51 E 200 N Unit 3
Your Personal Tour Guide
Ask me questions while you tour the home.