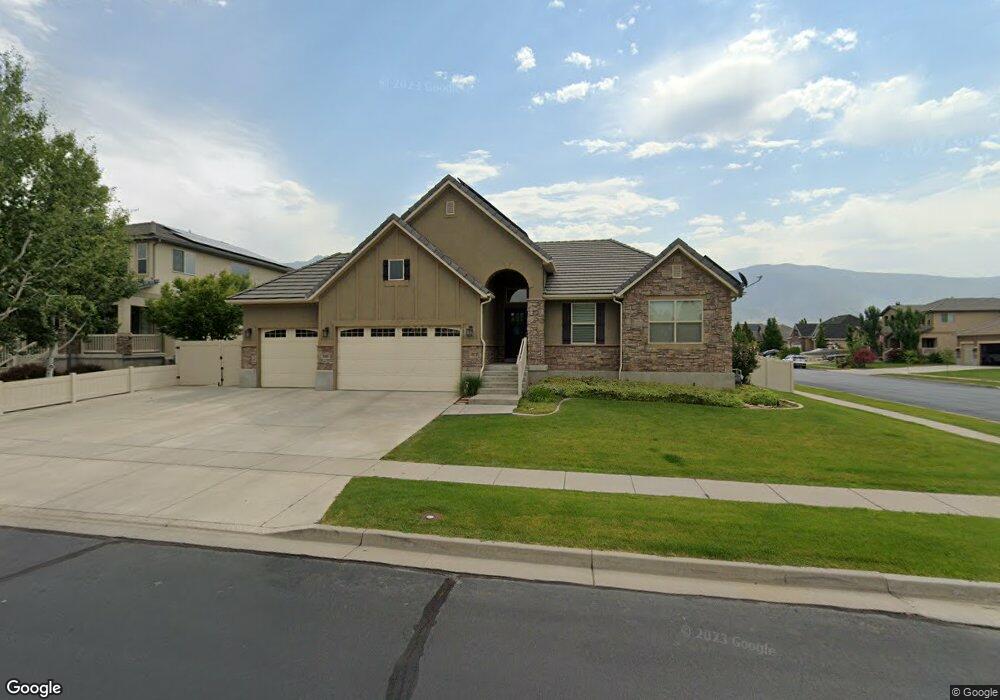
688 N 2050 W Farmington, UT 84025
Estimated Value: $610,000 - $825,000
3
Beds
3
Baths
3,314
Sq Ft
$211/Sq Ft
Est. Value
About This Home
This home is located at 688 N 2050 W, Farmington, UT 84025 and is currently estimated at $699,197, approximately $210 per square foot. 688 N 2050 W is a home located in Davis County with nearby schools including Endeavour Elementary School, Farmington High, and Centennial Junior High School.
Ownership History
Date
Name
Owned For
Owner Type
Purchase Details
Closed on
Aug 19, 2013
Sold by
Malmberg Eric L and Malmberg Kerryn L
Bought by
Gray Brent and Gray Jill
Current Estimated Value
Home Financials for this Owner
Home Financials are based on the most recent Mortgage that was taken out on this home.
Original Mortgage
$244,000
Outstanding Balance
$182,320
Interest Rate
4.51%
Mortgage Type
New Conventional
Estimated Equity
$516,877
Purchase Details
Closed on
Feb 19, 2009
Sold by
Richmond American Homes Of Utah Inc
Bought by
Malmberg Eric L and Malmberg Kerryn L
Home Financials for this Owner
Home Financials are based on the most recent Mortgage that was taken out on this home.
Original Mortgage
$279,837
Interest Rate
4.92%
Mortgage Type
FHA
Purchase Details
Closed on
May 29, 2007
Sold by
Sli Commercial Real Estate Co
Bought by
Richmond American Homes Of Utah Inc
Create a Home Valuation Report for This Property
The Home Valuation Report is an in-depth analysis detailing your home's value as well as a comparison with similar homes in the area
Home Values in the Area
Average Home Value in this Area
Purchase History
| Date | Buyer | Sale Price | Title Company |
|---|---|---|---|
| Gray Brent | -- | Aspen Title Insuranc | |
| Malmberg Eric L | -- | First American Title | |
| Richmond American Homes Of Utah Inc | -- | The Talon Group |
Source: Public Records
Mortgage History
| Date | Status | Borrower | Loan Amount |
|---|---|---|---|
| Open | Gray Brent | $244,000 | |
| Previous Owner | Malmberg Eric L | $279,837 |
Source: Public Records
Tax History Compared to Growth
Tax History
| Year | Tax Paid | Tax Assessment Tax Assessment Total Assessment is a certain percentage of the fair market value that is determined by local assessors to be the total taxable value of land and additions on the property. | Land | Improvement |
|---|---|---|---|---|
| 2024 | $3,400 | $339,900 | $151,516 | $188,384 |
| 2023 | $3,354 | $611,000 | $245,315 | $365,685 |
| 2022 | $3,285 | $339,900 | $135,056 | $204,844 |
| 2021 | $2,928 | $451,000 | $139,000 | $312,000 |
| 2020 | $2,657 | $399,000 | $134,233 | $264,767 |
| 2019 | $2,629 | $383,000 | $154,620 | $228,380 |
| 2018 | $2,466 | $354,000 | $139,098 | $214,902 |
| 2016 | $2,410 | $178,090 | $52,539 | $125,551 |
| 2015 | $2,457 | $172,260 | $52,539 | $119,721 |
| 2014 | $2,238 | $161,292 | $45,473 | $115,819 |
| 2013 | -- | $154,638 | $32,227 | $122,411 |
Source: Public Records
Map
Nearby Homes
- 1566 W Pheasant Place
- 926 N 1875 W
- 556 Innovator Dr Unit 158
- 276 E 2200 S
- 2261 S 50 E
- 2009 W Lonestar Dr
- 2274 S 50 E
- 562 Innovator Dr Unit 155
- 2266 S Betsys Way
- 1488 W Kiera Ct Unit 148
- 1844 Country Bend Cir
- 1484 W Kiera Ct Unit 146
- 69 W 2200 S
- 278 E Shepard Ln
- 604 Sego Way Unit 220
- 604 Sego Way Unit 207
- 1472 W Cook Ln Unit 164
- 2226 S Betsys Way
- 597 N Nichole Ln Unit 205
- 2071 S 400 E