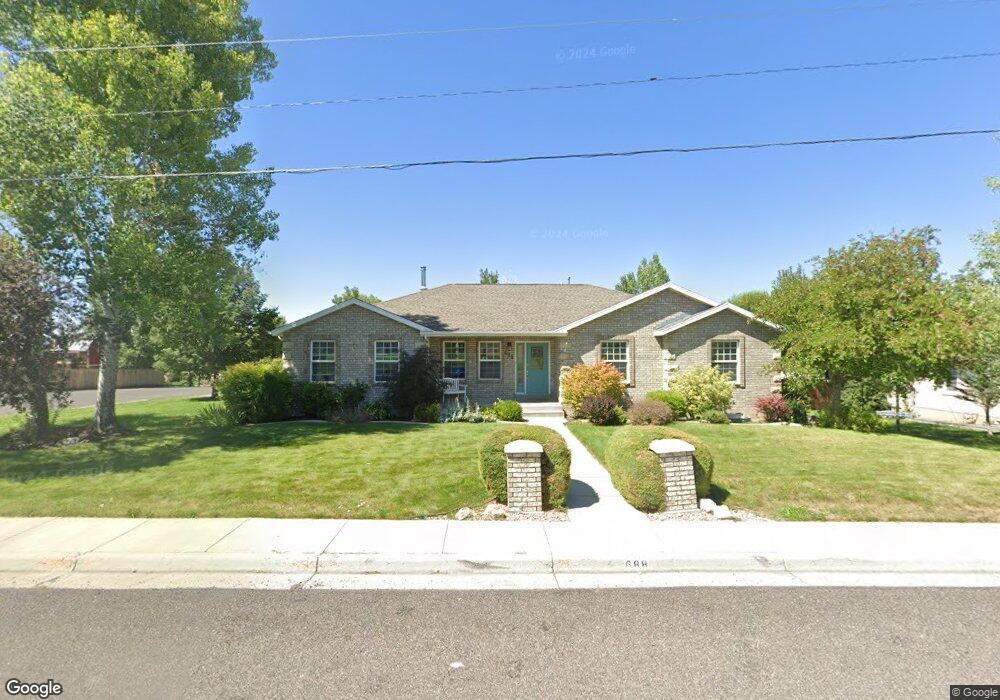
688 S 100 E Ephraim, UT 84627
Estimated Value: $474,000 - $636,000
6
Beds
3
Baths
4,176
Sq Ft
$133/Sq Ft
Est. Value
About This Home
This home is located at 688 S 100 E, Ephraim, UT 84627 and is currently estimated at $555,217, approximately $132 per square foot. 688 S 100 E is a home located in Sanpete County.
Ownership History
Date
Name
Owned For
Owner Type
Purchase Details
Closed on
Jul 31, 2019
Sold by
Taylor Huckstep
Bought by
Tanner William R
Current Estimated Value
Purchase Details
Closed on
Jul 31, 2017
Sold by
Anderson George M and Anderson Brooke L
Bought by
Huckstep Taylor
Home Financials for this Owner
Home Financials are based on the most recent Mortgage that was taken out on this home.
Original Mortgage
$280,489
Interest Rate
3.5%
Mortgage Type
FHA
Purchase Details
Closed on
May 24, 2010
Sold by
Hermansen Carl L and Hermansen Jeanie M
Bought by
Anderson George Mckay and Anderson Brooke L
Create a Home Valuation Report for This Property
The Home Valuation Report is an in-depth analysis detailing your home's value as well as a comparison with similar homes in the area
Home Values in the Area
Average Home Value in this Area
Purchase History
| Date | Buyer | Sale Price | Title Company |
|---|---|---|---|
| Tanner William R | $430,480 | Richland Title Ins Agcy | |
| Huckstep Taylor | $350,611 | -- | |
| Anderson George Mckay | -- | -- |
Source: Public Records
Mortgage History
| Date | Status | Borrower | Loan Amount |
|---|---|---|---|
| Previous Owner | Huckstep Taylor | $280,489 | |
| Closed | Tanner William R | $344,384 |
Source: Public Records
Tax History
| Year | Tax Paid | Tax Assessment Tax Assessment Total Assessment is a certain percentage of the fair market value that is determined by local assessors to be the total taxable value of land and additions on the property. | Land | Improvement |
|---|---|---|---|---|
| 2025 | $3,080 | $298,383 | $0 | $0 |
| 2024 | $3,110 | $286,314 | $0 | $0 |
| 2023 | $3,068 | $268,839 | $0 | $0 |
| 2022 | $3,143 | $250,969 | $0 | $0 |
| 2021 | $3,035 | $209,478 | $0 | $0 |
| 2020 | $2,817 | $183,027 | $0 | $0 |
| 2019 | $2,856 | $182,603 | $0 | $0 |
| 2018 | $2,578 | $288,699 | $31,977 | $256,722 |
| 2017 | $2,094 | $135,007 | $0 | $0 |
| 2016 | $1,982 | $127,818 | $0 | $0 |
| 2015 | $1,992 | $127,818 | $0 | $0 |
| 2014 | $1,959 | $127,818 | $0 | $0 |
| 2013 | $1,950 | $127,818 | $0 | $0 |
Source: Public Records
Map
Nearby Homes
Your Personal Tour Guide
Ask me questions while you tour the home.