
Seller's Agent in 2025
Glen Whitten
Ohio Property Group, LLC
(419) 790-3106
1,585 Total Sales
Estimated Value: $235,917 - $248,000
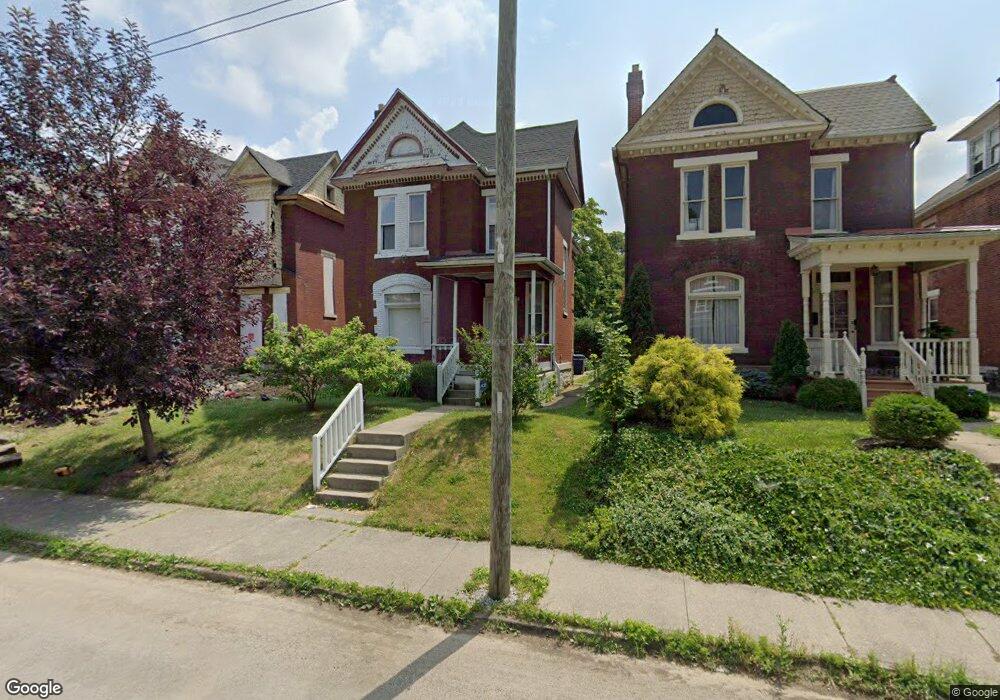
Discover timeless charm in the heart of the coveted Old Oaks Historic District. Perfect opportunity for anyone. This residence is move-in ready yet brimming with potential for personalization. Modernized plumbing and electrical systems ensure peace of mind. Roof, high efficiency furnace, and hot water heater all in excellent condition, built to last 10+ years. Hardwood floors are in good condition although worn in places. Kitchen floor is worn. Exterior trim is ready to be painted. House is cluttered due to health issues but will be cleaned out upon sale. Prime location, close to parks,
hospitals, restaurants, and grocery.
| Date | Buyer | Sale Price | Title Company |
|---|---|---|---|
| Williams Steve D | $16,000 | None Available | |
| Wells Fargo Bank Na | $44,000 | None Available | |
| Steele Alicia | $110,000 | None Available | |
| Cross Tabernacle Deliverance Church Inc | $2,291,500 | -- | |
| Srp Housing I Limited | $69,100 | -- | |
| -- | $11,500 | -- |
| Date | Status | Borrower | Loan Amount |
|---|---|---|---|
| Previous Owner | Steele Alicia | $99,000 | |
| Previous Owner | Cross Tabernacle Deliverance Church Inc | $2,000,000 |
| Date | Event | Price | List to Sale | Price per Sq Ft |
|---|---|---|---|---|
| 06/15/2025 06/15/25 | Price Changed | $245,000 | -7.5% | $143 / Sq Ft |
| 05/28/2025 05/28/25 | For Sale | $265,000 | -- | $155 / Sq Ft |
| Year | Tax Paid | Tax Assessment Tax Assessment Total Assessment is a certain percentage of the fair market value that is determined by local assessors to be the total taxable value of land and additions on the property. | Land | Improvement |
|---|---|---|---|---|
| 2024 | $2,366 | $62,510 | $30,520 | $31,990 |
| 2023 | $2,363 | $62,510 | $30,520 | $31,990 |
| 2022 | $2,790 | $44,590 | $8,050 | $36,540 |
| 2021 | $1,862 | $44,590 | $8,050 | $36,540 |
| 2020 | $1,865 | $44,590 | $8,050 | $36,540 |
| 2019 | $1,461 | $32,840 | $6,200 | $26,640 |
| 2018 | $838 | $32,840 | $6,200 | $26,640 |
| 2017 | $1,140 | $32,840 | $6,200 | $26,640 |
| 2016 | $819 | $21,110 | $3,050 | $18,060 |
| 2015 | $743 | $21,110 | $3,050 | $18,060 |
| 2014 | $1,273 | $21,110 | $3,050 | $18,060 |
| 2013 | $661 | $22,225 | $3,220 | $19,005 |
Seller's Agent in 2025
Glen Whitten
Ohio Property Group, LLC
(419) 790-3106
1,585 Total Sales