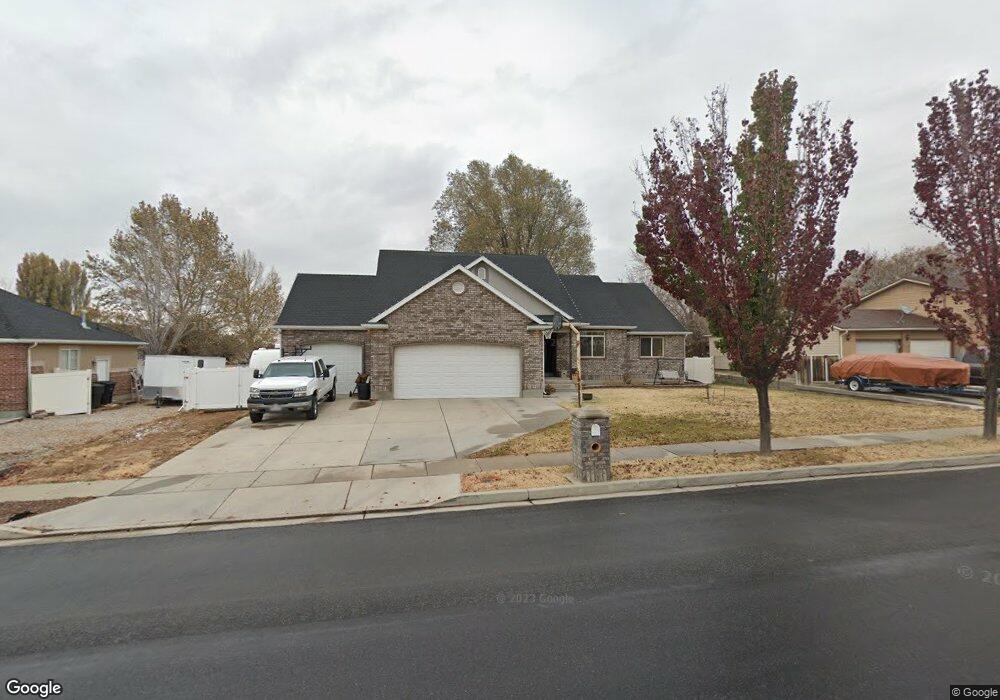
688 W 1520 N Clearfield, UT 84015
Estimated Value: $551,000 - $578,000
3
Beds
2
Baths
1,918
Sq Ft
$297/Sq Ft
Est. Value
About This Home
This home is located at 688 W 1520 N, Clearfield, UT 84015 and is currently estimated at $570,524, approximately $297 per square foot. 688 W 1520 N is a home located in Davis County with nearby schools including Sunset School, Sunset Junior High School, and Clearfield High School.
Ownership History
Date
Name
Owned For
Owner Type
Purchase Details
Closed on
Feb 1, 2006
Sold by
Keller Kim and Keller Cindy
Bought by
Asay K Bradley and Asay Tanya M
Current Estimated Value
Home Financials for this Owner
Home Financials are based on the most recent Mortgage that was taken out on this home.
Original Mortgage
$175,600
Outstanding Balance
$98,350
Interest Rate
6.21%
Mortgage Type
Fannie Mae Freddie Mac
Estimated Equity
$472,174
Create a Home Valuation Report for This Property
The Home Valuation Report is an in-depth analysis detailing your home's value as well as a comparison with similar homes in the area
Home Values in the Area
Average Home Value in this Area
Purchase History
| Date | Buyer | Sale Price | Title Company |
|---|---|---|---|
| Asay K Bradley | -- | Heritage West Title Ins Agen |
Source: Public Records
Mortgage History
| Date | Status | Borrower | Loan Amount |
|---|---|---|---|
| Open | Asay K Bradley | $175,600 |
Source: Public Records
Tax History Compared to Growth
Tax History
| Year | Tax Paid | Tax Assessment Tax Assessment Total Assessment is a certain percentage of the fair market value that is determined by local assessors to be the total taxable value of land and additions on the property. | Land | Improvement |
|---|---|---|---|---|
| 2025 | $3,203 | $308,000 | $98,914 | $209,086 |
| 2024 | $3,078 | $297,550 | $107,810 | $189,740 |
| 2023 | $2,896 | $518,000 | $124,272 | $393,728 |
| 2022 | $3,080 | $304,700 | $74,060 | $230,640 |
| 2021 | $2,759 | $405,000 | $96,040 | $308,960 |
| 2020 | $2,396 | $348,000 | $83,418 | $264,582 |
| 2019 | $2,311 | $328,000 | $94,143 | $233,857 |
| 2018 | $2,202 | $307,000 | $79,091 | $227,909 |
| 2016 | $1,993 | $143,440 | $31,169 | $112,271 |
| 2015 | $2,002 | $137,060 | $31,169 | $105,891 |
| 2014 | $1,856 | $129,062 | $31,169 | $97,893 |
| 2013 | -- | $131,629 | $27,373 | $104,256 |
Source: Public Records
Map
Nearby Homes