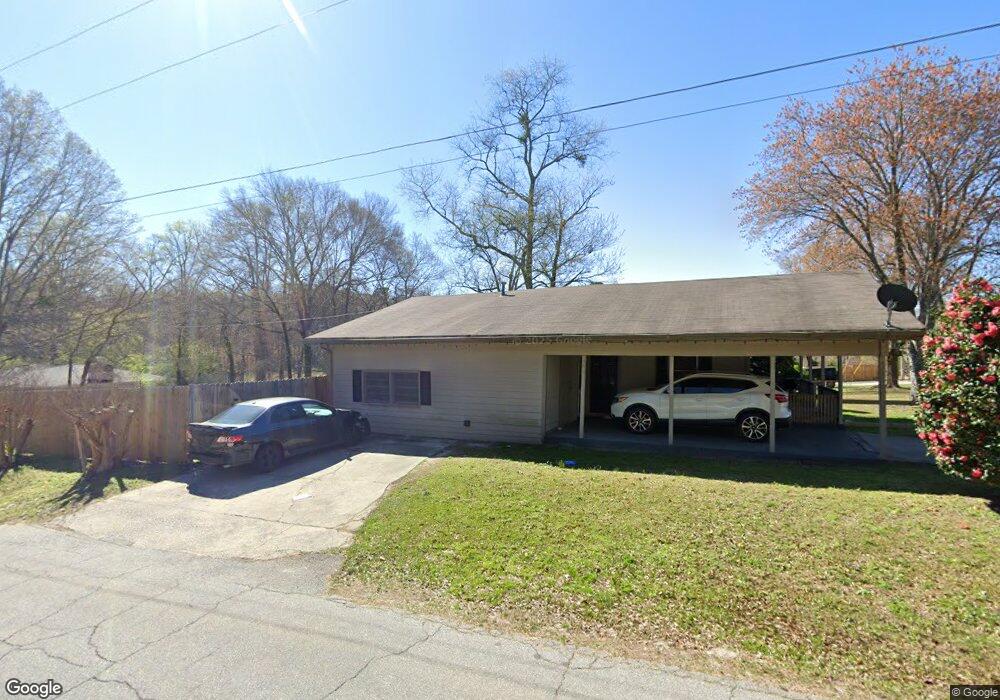
6882 County Line Rd Lithia Springs, GA 30122
Lithia Springs NeighborhoodEstimated Value: $242,000 - $305,000
4
Beds
4
Baths
1,760
Sq Ft
$153/Sq Ft
Est. Value
About This Home
This home is located at 6882 County Line Rd, Lithia Springs, GA 30122 and is currently estimated at $270,040, approximately $153 per square foot. 6882 County Line Rd is a home located in Douglas County with nearby schools including Lithia Springs Elementary School, Turner Middle School, and Lithia Springs Comprehensive High School.
Ownership History
Date
Name
Owned For
Owner Type
Purchase Details
Closed on
May 6, 2022
Sold by
Whiteside Phillip T
Bought by
Serrano Guillermo and Villagrana Veronica
Current Estimated Value
Home Financials for this Owner
Home Financials are based on the most recent Mortgage that was taken out on this home.
Original Mortgage
$193,325
Outstanding Balance
$183,687
Interest Rate
5.27%
Mortgage Type
FHA
Estimated Equity
$86,353
Purchase Details
Closed on
Jan 7, 2022
Sold by
Whiteside Phillip T
Bought by
Clay Georgia and Clay Robin
Purchase Details
Closed on
Dec 16, 2004
Sold by
Spradlin Juanita
Bought by
Whiteside Phillip T
Home Financials for this Owner
Home Financials are based on the most recent Mortgage that was taken out on this home.
Original Mortgage
$100,000
Interest Rate
5.67%
Mortgage Type
New Conventional
Create a Home Valuation Report for This Property
The Home Valuation Report is an in-depth analysis detailing your home's value as well as a comparison with similar homes in the area
Home Values in the Area
Average Home Value in this Area
Purchase History
| Date | Buyer | Sale Price | Title Company |
|---|---|---|---|
| Serrano Guillermo | $240,000 | None Listed On Document | |
| Clay Georgia | $285,000 | Hartley Rowe & Fowler Pc | |
| Whiteside Phillip T | $80,000 | -- |
Source: Public Records
Mortgage History
| Date | Status | Borrower | Loan Amount |
|---|---|---|---|
| Open | Serrano Guillermo | $193,325 | |
| Previous Owner | Whiteside Phillip T | $100,000 |
Source: Public Records
Tax History Compared to Growth
Tax History
| Year | Tax Paid | Tax Assessment Tax Assessment Total Assessment is a certain percentage of the fair market value that is determined by local assessors to be the total taxable value of land and additions on the property. | Land | Improvement |
|---|---|---|---|---|
| 2024 | $2,997 | $95,240 | $22,400 | $72,840 |
| 2023 | $2,997 | $95,240 | $22,400 | $72,840 |
| 2022 | $1,745 | $53,600 | $14,000 | $39,600 |
| 2021 | $1,637 | $50,200 | $15,520 | $34,680 |
| 2020 | $1,341 | $40,440 | $8,880 | $31,560 |
| 2019 | $1,213 | $39,160 | $8,880 | $30,280 |
| 2018 | $1,196 | $38,440 | $8,880 | $29,560 |
| 2017 | $761 | $24,000 | $6,299 | $17,701 |
| 2016 | $774 | $24,000 | $6,299 | $17,701 |
| 2015 | $538 | $27,080 | $7,360 | $19,720 |
| 2014 | $538 | $16,000 | $6,160 | $9,840 |
| 2013 | -- | $21,232 | $6,160 | $15,072 |
Source: Public Records
Map
Nearby Homes
- 0 Miller St Unit 10574225
- 6906 Cherry Cir
- 7104 Miller St
- 3916 S Martin Way
- 6600 N Beulah Rd
- 6717 S Sweetwater Rd
- 2500 Rosehill Cir
- 4022 Creel Dr
- 7011 S Sweetwater Rd
- 6538 N Sweetwater Rd
- 6069 Wisteria Ln
- 3476 Cooper St
- 7146 Old Beulah Rd
- 540 Boulder Park Dr
- 11041 Veterans Memorial Hwy
- 0 Mckown Rd Unit 7632191
- 0 Mckown Rd Unit 10583796
- 6435 Joanna St
- 4365 Clare Ln
- 6531 Temple St
- 6882 N County Line Rd
- 6894 County Line Rd
- 6866 County Line Rd
- 3866 Lithia Way
- 3871 Lithia Way
- 6885 County Line Rd
- 6858 County Line Rd
- 6910 County Line Rd
- 3852 Lithia Way
- 3909 Lithia Way
- 3857 Lithia Way
- 3922 Lithia Way
- 6905 County Line Rd
- 6851 County Line Rd
- 3876 Spring Dr
- 3936 Lithia Way
- 3866 Spring Dr
- 3836 Lithia Way
- 3939 Lithia Way
- 3837 Lithia Way