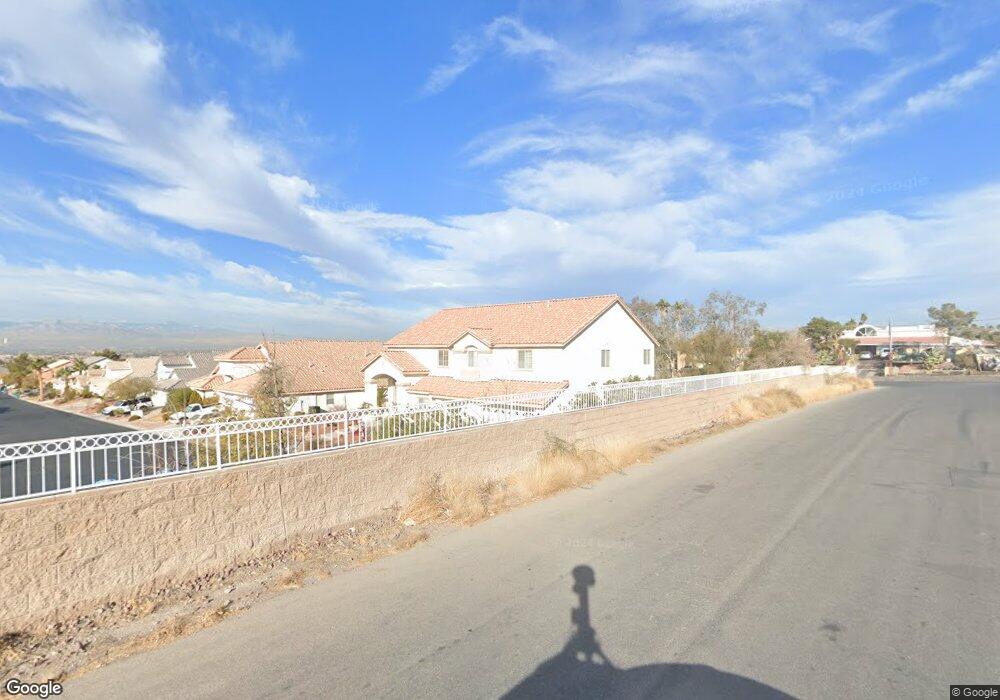
6886 Ancestral Hills Ln Unit 3 Las Vegas, NV 89110
Estimated Value: $728,541 - $820,000
5
Beds
3
Baths
4,058
Sq Ft
$192/Sq Ft
Est. Value
About This Home
This home is located at 6886 Ancestral Hills Ln Unit 3, Las Vegas, NV 89110 and is currently estimated at $781,135, approximately $192 per square foot. 6886 Ancestral Hills Ln Unit 3 is a home located in Clark County with nearby schools including Mervin Iverson Elementary School, Kathleen & Tim Harney Middle School, and Las Vegas High School.
Ownership History
Date
Name
Owned For
Owner Type
Purchase Details
Closed on
Jun 24, 2003
Sold by
Sharp Michael L and Sharp Sheri L
Bought by
Gammon Gregory W and Gammon Debra
Current Estimated Value
Home Financials for this Owner
Home Financials are based on the most recent Mortgage that was taken out on this home.
Original Mortgage
$312,050
Outstanding Balance
$113,992
Interest Rate
3.5%
Mortgage Type
Unknown
Estimated Equity
$667,143
Purchase Details
Closed on
Sep 18, 2000
Sold by
U S Home Corp
Bought by
Sharp Michael L and Sharp Sheri L
Home Financials for this Owner
Home Financials are based on the most recent Mortgage that was taken out on this home.
Original Mortgage
$151,500
Interest Rate
8.07%
Mortgage Type
Balloon
Create a Home Valuation Report for This Property
The Home Valuation Report is an in-depth analysis detailing your home's value as well as a comparison with similar homes in the area
Home Values in the Area
Average Home Value in this Area
Purchase History
| Date | Buyer | Sale Price | Title Company |
|---|---|---|---|
| Gammon Gregory W | $328,500 | Ticor Title Of Nevada Inc | |
| Sharp Michael L | $280,240 | Stewart Title |
Source: Public Records
Mortgage History
| Date | Status | Borrower | Loan Amount |
|---|---|---|---|
| Open | Gammon Gregory W | $312,050 | |
| Previous Owner | Sharp Michael L | $151,500 | |
| Closed | Sharp Michael L | $24,000 |
Source: Public Records
Tax History Compared to Growth
Tax History
| Year | Tax Paid | Tax Assessment Tax Assessment Total Assessment is a certain percentage of the fair market value that is determined by local assessors to be the total taxable value of land and additions on the property. | Land | Improvement |
|---|---|---|---|---|
| 2025 | $3,486 | $182,932 | $54,250 | $128,682 |
| 2024 | $3,385 | $182,932 | $54,250 | $128,682 |
| 2023 | $3,385 | $173,189 | $50,750 | $122,439 |
| 2022 | $3,603 | $156,987 | $45,500 | $111,487 |
| 2021 | $3,336 | $142,946 | $36,750 | $106,196 |
| 2020 | $3,095 | $138,539 | $33,250 | $105,289 |
| 2019 | $2,901 | $133,600 | $29,750 | $103,850 |
| 2018 | $2,768 | $122,829 | $29,750 | $93,079 |
| 2017 | $3,766 | $128,327 | $28,000 | $100,327 |
| 2016 | $2,591 | $97,179 | $19,250 | $77,929 |
| 2015 | $2,585 | $85,451 | $17,500 | $67,951 |
| 2014 | $2,510 | $84,639 | $14,000 | $70,639 |
Source: Public Records
Map
Nearby Homes
- 255 Vista Valley St
- 0 Vista Valley St
- 485 Sari Dr
- 0 Peaceful St
- 6677 Turtle Hill Rd
- 6688 Martinsville Place
- 6632 Isolated Ave
- 6664 Secluded Ave
- 706 N Hollywood Blvd
- 738 Rossmore Dr
- 6520 Turtle Hill Rd
- 100 Spanish Dr
- 6596 Secluded Ave
- 0 Linden Ave
- 853 Morning Sun Ct
- 6440 Spanish Garden Ct
- 650 N Hollywood Blvd
- 0 Sunrise & Phyllis Unit 2712586
- 807 Sun Shimmer Place
- 6400 Stewart Ave
- 6872 Ancestral Hills Ln
- 6872 Ancestral Hills Ln Unit n/a
- 6885 Ancestral Hills Ln
- 395 Radwick Dr
- 6858 Ancestral Hills Ln
- 6865 Ancestral Hills Ln
- 6892 Stewart Ave
- 6876 Stewart Ave
- 380 Radwick Dr
- 6844 Ancestral Hills Ln
- 6880 Historic Legacy Ct
- 6860 Stewart Ave
- 6845 Ancestral Hills Ln
- 390 Radwick Dr
- 6860 Historic Legacy Ct Unit 3
- 416 Rossmore Dr
- 6830 Ancestral Hills Ln
- 6840 Historic Legacy Ct
- 6942 Stewart Ave
- 432 Rossmore Dr