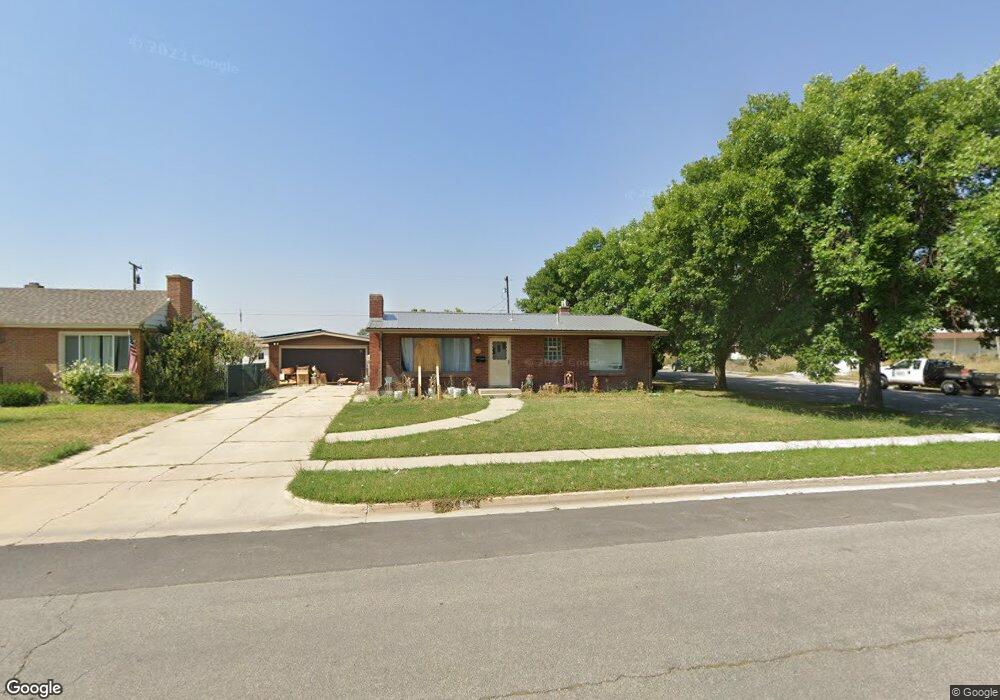
689 N 200 E Tremonton, UT 84337
Estimated Value: $360,000 - $424,000
4
Beds
2
Baths
2,160
Sq Ft
$178/Sq Ft
Est. Value
About This Home
This home is located at 689 N 200 E, Tremonton, UT 84337 and is currently estimated at $383,614, approximately $177 per square foot. 689 N 200 E is a home located in Box Elder County with nearby schools including North Park School, Bear River Middle School, and Alice C. Harris Intermediate School.
Ownership History
Date
Name
Owned For
Owner Type
Purchase Details
Closed on
Dec 29, 2020
Sold by
Dyer Devin and Dyer Sawyer L
Bought by
Kasperski Seth Kent and Cuch Keith
Current Estimated Value
Home Financials for this Owner
Home Financials are based on the most recent Mortgage that was taken out on this home.
Original Mortgage
$259,255
Outstanding Balance
$231,345
Interest Rate
2.7%
Mortgage Type
New Conventional
Estimated Equity
$152,269
Purchase Details
Closed on
Oct 9, 2017
Sold by
Dyer Devin
Bought by
Dyer Devin and Dyer Sawyer L
Home Financials for this Owner
Home Financials are based on the most recent Mortgage that was taken out on this home.
Original Mortgage
$176,666
Interest Rate
3.86%
Mortgage Type
New Conventional
Purchase Details
Closed on
May 9, 2016
Sold by
Hsbc Bank Usa Na
Bought by
Roberts Jonathan
Create a Home Valuation Report for This Property
The Home Valuation Report is an in-depth analysis detailing your home's value as well as a comparison with similar homes in the area
Home Values in the Area
Average Home Value in this Area
Purchase History
| Date | Buyer | Sale Price | Title Company |
|---|---|---|---|
| Kasperski Seth Kent | -- | American Secure Ttl Tremonto | |
| Dyer Devin | -- | American Secure Title Tremon | |
| Dyer Devin | -- | American Secure Title Tremon | |
| Roberts Jonathan | -- | Meridian Title Co |
Source: Public Records
Mortgage History
| Date | Status | Borrower | Loan Amount |
|---|---|---|---|
| Open | Kasperski Seth Kent | $259,255 | |
| Previous Owner | Dyer Devin | $176,666 |
Source: Public Records
Tax History
| Year | Tax Paid | Tax Assessment Tax Assessment Total Assessment is a certain percentage of the fair market value that is determined by local assessors to be the total taxable value of land and additions on the property. | Land | Improvement |
|---|---|---|---|---|
| 2025 | $2,309 | $359,292 | $105,000 | $254,292 |
| 2024 | $2,057 | $356,240 | $105,000 | $251,240 |
| 2023 | $2,155 | $366,376 | $100,000 | $266,376 |
| 2022 | $1,904 | $184,611 | $16,500 | $168,111 |
| 2021 | $1,554 | $202,200 | $30,000 | $172,200 |
| 2020 | $1,313 | $202,200 | $30,000 | $172,200 |
| 2019 | $1,221 | $100,314 | $16,500 | $83,814 |
| 2018 | $1,023 | $76,742 | $13,750 | $62,992 |
| 2017 | $1,056 | $139,530 | $13,750 | $114,530 |
| 2016 | $1,040 | $73,742 | $13,750 | $59,992 |
| 2015 | $946 | $68,288 | $13,750 | $54,538 |
| 2014 | $946 | $65,691 | $13,750 | $51,941 |
| 2013 | -- | $65,691 | $13,338 | $52,353 |
Source: Public Records
Map
Nearby Homes
- 785 N 200 E
- 278 N 870 E
- 278 N 870 E Unit 17
- 524 N 100 E
- 780 N 350 E
- 384 N 200 E
- 960 N 100 W
- 978 N Tremont St
- 90 E 1300 S
- 235 E 1400 S
- 708 N 600 W
- 776 N 600 W Unit 210
- 776 N 600 W
- 116 N Tremont St
- 768 N 600 W Unit 211
- 678 N 600 W Unit 103
- 672 N 600 W
- 725 N 600 W Unit 111
- 711 N 600 W Unit 113
- 719 N 600 W Unit 112
Your Personal Tour Guide
Ask me questions while you tour the home.