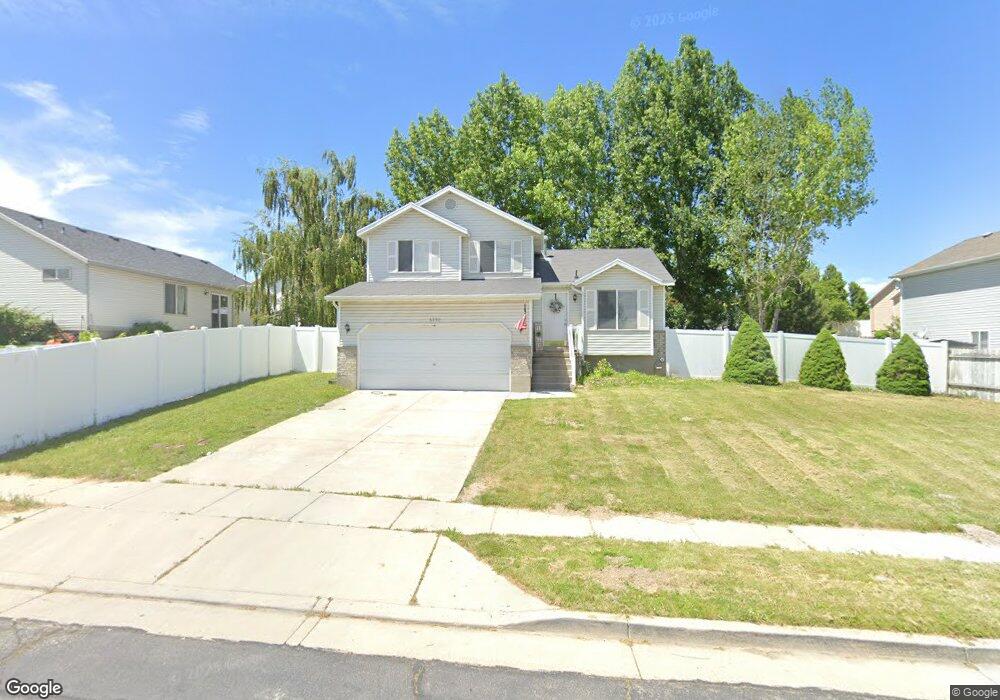
6890 S Jackling Way West Jordan, UT 84081
Oquirrh NeighborhoodEstimated Value: $498,000 - $564,000
4
Beds
3
Baths
1,704
Sq Ft
$302/Sq Ft
Est. Value
About This Home
This home is located at 6890 S Jackling Way, West Jordan, UT 84081 and is currently estimated at $514,566, approximately $301 per square foot. 6890 S Jackling Way is a home located in Salt Lake County with nearby schools including Falcon Ridge School, Sunset Ridge Middle School, and Copper Hills High School.
Ownership History
Date
Name
Owned For
Owner Type
Purchase Details
Closed on
Nov 25, 2014
Sold by
American Homes 4 Rent Properties Five Ll
Bought by
Amh 2014 3 Borrower Llc
Current Estimated Value
Purchase Details
Closed on
May 10, 2013
Sold by
Butterworth Eric P and Butterworth Dawnette
Bought by
American Homes 4 Rent Properties Five Ll
Purchase Details
Closed on
Jun 1, 2001
Sold by
Butterworth Eric P and Page Dawnette
Bought by
Butterworth Eric P and Butterworth Dawnette
Purchase Details
Closed on
Mar 19, 1999
Sold by
Rochelle Park Lc
Bought by
Butterworth Eric P and Page Dawnette
Home Financials for this Owner
Home Financials are based on the most recent Mortgage that was taken out on this home.
Original Mortgage
$131,135
Interest Rate
6.73%
Mortgage Type
FHA
Create a Home Valuation Report for This Property
The Home Valuation Report is an in-depth analysis detailing your home's value as well as a comparison with similar homes in the area
Home Values in the Area
Average Home Value in this Area
Purchase History
| Date | Buyer | Sale Price | Title Company |
|---|---|---|---|
| Amh 2014 3 Borrower Llc | -- | None Available | |
| American Homes 4 Rent Properties Five Ll | -- | North American Title | |
| Butterworth Eric P | -- | First American Title | |
| Butterworth Eric P | -- | Merrill Title |
Source: Public Records
Mortgage History
| Date | Status | Borrower | Loan Amount |
|---|---|---|---|
| Previous Owner | Butterworth Eric P | $131,135 |
Source: Public Records
Tax History Compared to Growth
Tax History
| Year | Tax Paid | Tax Assessment Tax Assessment Total Assessment is a certain percentage of the fair market value that is determined by local assessors to be the total taxable value of land and additions on the property. | Land | Improvement |
|---|---|---|---|---|
| 2025 | $2,534 | $462,900 | $150,000 | $312,900 |
| 2024 | $2,534 | $428,300 | $144,200 | $284,100 |
| 2023 | $2,553 | $405,500 | $138,700 | $266,800 |
| 2022 | $2,665 | $420,700 | $136,000 | $284,700 |
| 2021 | $2,330 | $341,500 | $104,600 | $236,900 |
| 2020 | $2,276 | $311,500 | $97,000 | $214,500 |
| 2019 | $2,221 | $297,300 | $91,500 | $205,800 |
| 2018 | $2,056 | $271,600 | $91,500 | $180,100 |
| 2017 | $1,963 | $255,500 | $91,500 | $164,000 |
| 2016 | $2,005 | $245,500 | $84,700 | $160,800 |
| 2015 | $1,936 | $228,700 | $94,900 | $133,800 |
| 2014 | $1,739 | $201,800 | $92,100 | $109,700 |
Source: Public Records
Map
Nearby Homes
- 6977 W Hidden Way S Unit 147
- 6116 W Graceland Way
- 6150 W Nellies St
- 6721 Adventure Way
- 6739 S Sol Rise Dr
- 5732 W Moon Crest Ct
- 6761 S High Bluff Dr
- 7134 S Rialto Way
- 5557 W Joshua Cir
- 6301 W Passenger Ln Unit 2
- 5502 Starflower Way
- 5818 W Whisper View Ct
- 5818 W Whisper View Ct Unit 336
- 6922 Mullien Dr
- 5466 Ticklegrass Rd
- 7296 S Sophia Ridge Ct
- 7758 S Iron Core Ln
- 7146 W Owens View Way Unit 204
- 7259 W Cibola Rd
- 6853 Mullien Dr Unit 5420
- 6890 Jackling Way
- 6878 Jackling Way
- 5902 W Feldspar Way
- 5902 Feldspar Way
- 5912 Feldspar Way
- 6881 Grand Valley Place
- 6875 Grand Valley Place
- 6875 S Grand Valley Place
- 6881 S Grand Valley Place
- 6897 S Jackling Way
- 6897 Jackling Way
- 6868 Jackling Way
- 6868 S Jackling Way
- 5922 Feldspar Way
- 6887 S Jackling Way
- 6887 Jackling Way
- 5922 W Feldspar Way
- 6905 Jackling Way
- 6907 Jackling Way
- 6877 S Jackling Way