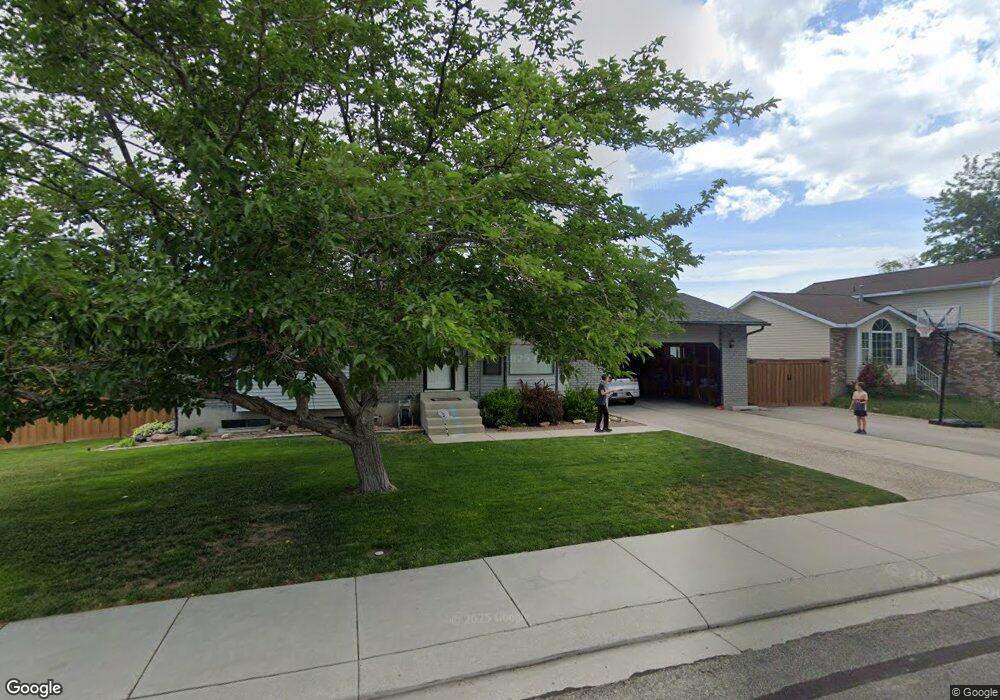
6893 S Sandlily Cir West Jordan, UT 84081
Oquirrh NeighborhoodEstimated Value: $476,000 - $509,277
6
Beds
2
Baths
2,292
Sq Ft
$215/Sq Ft
Est. Value
About This Home
This home is located at 6893 S Sandlily Cir, West Jordan, UT 84081 and is currently estimated at $493,069, approximately $215 per square foot. 6893 S Sandlily Cir is a home located in Salt Lake County with nearby schools including Mountain Shadows School, West Hills Middle School, and Copper Hills High School.
Ownership History
Date
Name
Owned For
Owner Type
Purchase Details
Closed on
Apr 27, 2011
Sold by
The Secretary Of Housing & Urban Develop
Bought by
Ferre Brett and Ferre Kathryn
Current Estimated Value
Home Financials for this Owner
Home Financials are based on the most recent Mortgage that was taken out on this home.
Original Mortgage
$126,000
Outstanding Balance
$86,916
Interest Rate
4.72%
Mortgage Type
New Conventional
Estimated Equity
$406,153
Purchase Details
Closed on
Jul 14, 2010
Sold by
Us Bank Na
Bought by
The Secretary Of Housing & Urban Develop
Purchase Details
Closed on
Jun 23, 2010
Sold by
Hansen Nicholas B and Hansen Kimberly
Bought by
Us Bank Na
Purchase Details
Closed on
Apr 28, 2008
Sold by
Hansen Nicholas
Bought by
Hansen Nicholas B and Hansen Kimberly
Home Financials for this Owner
Home Financials are based on the most recent Mortgage that was taken out on this home.
Original Mortgage
$192,850
Interest Rate
5.81%
Mortgage Type
New Conventional
Purchase Details
Closed on
Sep 12, 2006
Sold by
Kinnick Robert D and Kinnick Sandra S
Bought by
Hansen Nicholas
Home Financials for this Owner
Home Financials are based on the most recent Mortgage that was taken out on this home.
Original Mortgage
$160,000
Interest Rate
6.56%
Mortgage Type
Purchase Money Mortgage
Create a Home Valuation Report for This Property
The Home Valuation Report is an in-depth analysis detailing your home's value as well as a comparison with similar homes in the area
Home Values in the Area
Average Home Value in this Area
Purchase History
| Date | Buyer | Sale Price | Title Company |
|---|---|---|---|
| Ferre Brett | -- | Monument Title Ins Co | |
| The Secretary Of Housing & Urban Develop | -- | None Available | |
| Us Bank Na | $205,555 | None Available | |
| Hansen Nicholas B | -- | Metro National Title | |
| Hansen Nicholas | -- | Surety Title |
Source: Public Records
Mortgage History
| Date | Status | Borrower | Loan Amount |
|---|---|---|---|
| Open | Ferre Brett | $126,000 | |
| Previous Owner | Hansen Nicholas B | $192,850 | |
| Previous Owner | Hansen Nicholas | $160,000 |
Source: Public Records
Tax History Compared to Growth
Tax History
| Year | Tax Paid | Tax Assessment Tax Assessment Total Assessment is a certain percentage of the fair market value that is determined by local assessors to be the total taxable value of land and additions on the property. | Land | Improvement |
|---|---|---|---|---|
| 2025 | $2,650 | $474,300 | $133,600 | $340,700 |
| 2024 | $2,650 | $448,000 | $126,000 | $322,000 |
| 2023 | $2,647 | $420,400 | $121,100 | $299,300 |
| 2022 | $2,581 | $407,400 | $118,700 | $288,700 |
| 2021 | $2,290 | $335,600 | $91,300 | $244,300 |
| 2020 | $2,136 | $292,400 | $91,300 | $201,100 |
| 2019 | $2,085 | $279,200 | $86,200 | $193,000 |
| 2018 | $1,959 | $258,800 | $86,200 | $172,600 |
| 2017 | $1,666 | $216,900 | $86,200 | $130,700 |
| 2016 | $1,631 | $199,700 | $86,200 | $113,500 |
| 2015 | $1,596 | $188,600 | $82,500 | $106,100 |
| 2014 | $1,561 | $181,200 | $80,000 | $101,200 |
Source: Public Records
Map
Nearby Homes
- 6928 Beargrass Rd
- 5281 Saguaro Dr
- 6839 S Cyclamen Dr
- 6706 Marshrock Rd
- 4983 Shooting Star Ave
- 7232 W Terraine Rd
- 7238 W Terraine Rd
- 7246 W Terraine Rd
- 5183 W Cadenza Dr
- 7043 S Orion Hill Rd
- 7043 Orion Hill Rd
- 6853 Mullien Dr Unit 5420
- 5208 W Case Mountain Rd
- 7758 S Iron Core Ln
- 7146 W Owens View Way Unit 204
- 7259 W Cibola Rd
- 6635 S Milfoil Cir
- 4891 Calyx Cir
- 4888 Ticklegrass Rd
- 5151 Case Mountain Rd
- 6893 Sandlily Cir
- 5137 W Ticklegrass Rd
- 6905 S Sandlily Cir
- 5137 Ticklegrass Rd
- 5171 Ticklegrass Rd
- 6913 Sandlily Cir
- 5154 W Ticklegrass Rd
- 5154 Ticklegrass Rd
- 5144 Ticklegrass Rd
- 5144 W Ticklegrass Rd
- 6894 Beargrass Rd
- 6904 S Beargrass Rd
- 5166 Ticklegrass Rd
- 5166 W Ticklegrass Rd
- 6904 Beargrass Rd
- 6906 Sandlily Cir
- 5134 W Ticklegrass Rd
- 5134 Ticklegrass Rd
- 6921 Sandlily Cir
- 6912 Beargrass Rd