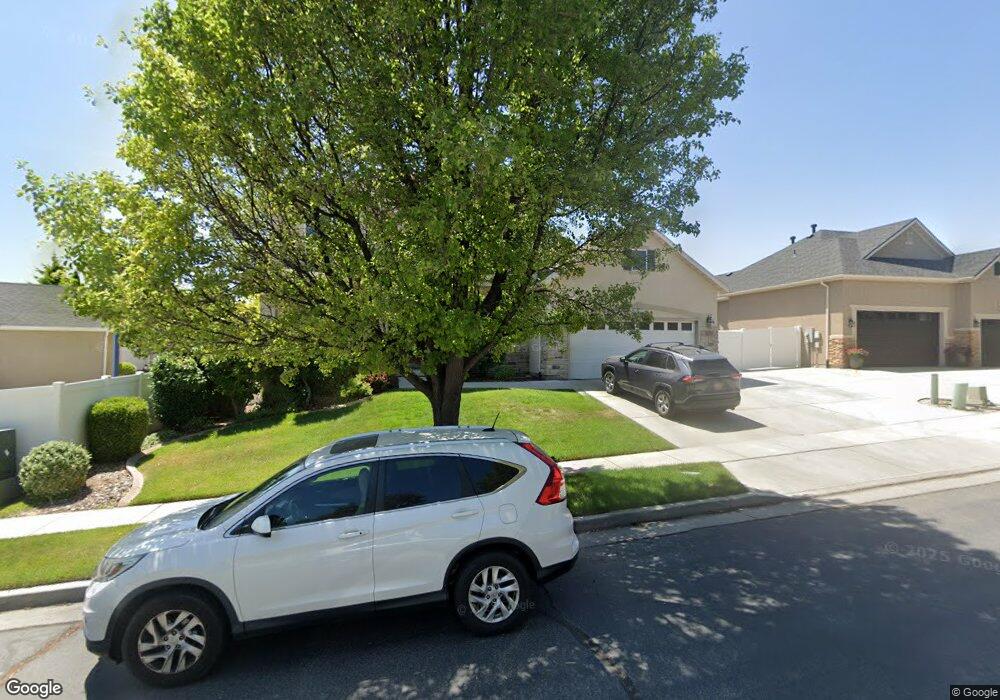
6894 S Bateman Dell Way West Jordan, UT 84084
Estimated Value: $673,000 - $725,014
4
Beds
4
Baths
3,680
Sq Ft
$191/Sq Ft
Est. Value
About This Home
This home is located at 6894 S Bateman Dell Way, West Jordan, UT 84084 and is currently estimated at $703,504, approximately $191 per square foot. 6894 S Bateman Dell Way is a home located in Salt Lake County with nearby schools including Heartland Elementary School, West Jordan Middle School, and West Jordan High School.
Ownership History
Date
Name
Owned For
Owner Type
Purchase Details
Closed on
Mar 9, 2021
Sold by
Lovell Bryce P and Lovell Laura W
Bought by
Lovell Bryce P and Lovell Laura W
Current Estimated Value
Purchase Details
Closed on
Jun 26, 2007
Sold by
Litzinger Michael B and Litzinger Julie M
Bought by
Lovell Bryce P and Lovell Laura W
Home Financials for this Owner
Home Financials are based on the most recent Mortgage that was taken out on this home.
Original Mortgage
$305,800
Outstanding Balance
$188,221
Interest Rate
6.21%
Mortgage Type
Purchase Money Mortgage
Estimated Equity
$515,283
Purchase Details
Closed on
Feb 26, 2003
Sold by
Mcarthur Homes At Bateman Farms Lc
Bought by
Litzinger Michael B and Litzinger Julie M
Home Financials for this Owner
Home Financials are based on the most recent Mortgage that was taken out on this home.
Original Mortgage
$210,880
Interest Rate
5.93%
Create a Home Valuation Report for This Property
The Home Valuation Report is an in-depth analysis detailing your home's value as well as a comparison with similar homes in the area
Home Values in the Area
Average Home Value in this Area
Purchase History
| Date | Buyer | Sale Price | Title Company |
|---|---|---|---|
| Lovell Bryce P | -- | None Available | |
| Lovell Bryce P | -- | Cottonwood Title Ins Agency | |
| Litzinger Michael B | -- | Surety Title |
Source: Public Records
Mortgage History
| Date | Status | Borrower | Loan Amount |
|---|---|---|---|
| Open | Lovell Bryce P | $305,800 | |
| Previous Owner | Litzinger Michael B | $210,880 |
Source: Public Records
Tax History Compared to Growth
Tax History
| Year | Tax Paid | Tax Assessment Tax Assessment Total Assessment is a certain percentage of the fair market value that is determined by local assessors to be the total taxable value of land and additions on the property. | Land | Improvement |
|---|---|---|---|---|
| 2025 | $3,399 | $673,700 | $133,600 | $540,100 |
| 2024 | $3,399 | $653,900 | $129,100 | $524,800 |
| 2023 | $3,321 | $602,200 | $117,400 | $484,800 |
| 2022 | $3,461 | $617,500 | $115,100 | $502,400 |
| 2021 | $2,914 | $473,200 | $90,100 | $383,100 |
| 2020 | $2,690 | $409,900 | $90,100 | $319,800 |
| 2019 | $2,699 | $403,300 | $90,100 | $313,200 |
| 2018 | $2,564 | $380,000 | $88,200 | $291,800 |
| 2017 | $2,432 | $358,900 | $88,200 | $270,700 |
| 2016 | $2,467 | $342,100 | $88,200 | $253,900 |
| 2015 | $2,432 | $328,800 | $92,600 | $236,200 |
| 2014 | $2,330 | $310,100 | $88,200 | $221,900 |
Source: Public Records
Map
Nearby Homes
- 6937 S Hollow View Way
- 6773 S 1300 W
- 6987 Overview Way
- 6687 Bonham Ln
- 7087 S 1205 W
- 7108 S 1205 W
- 6660 S Ryker Vista Ln
- 6440 S 1190 W Unit 200
- 6486 S 1140 W Unit 182
- 6494 S 1090 W Unit 152
- 6481 S 1090 W Unit 133
- 1146 Athleen Dr
- 6618 1420 W
- 6414 S 1090 W
- 1235 W Athleen Dr
- 6500 S 990 W
- 7165 Callie Dr
- 7118 S Equator Ln Unit 14 B
- 7194 S 1380 W
- 1384 W 7290 S
- 6894 Bateman Dell Way
- 6886 Bateman Dell Way
- 1212 Bateman Ponds Way
- 6899 S Bateman Field Dr
- 6891 Bateman Field Dr
- 6899 Bateman Field Dr
- 6891 S Bateman Field Dr
- 6878 S Bateman Dell Way
- 6878 Bateman Dell Way
- 6881 Bateman Field Dr
- 6889 Bateman Dell Way
- 6909 Bateman Field Dr
- 6883 Bateman Dell Way
- 6874 Bateman Dell Way
- 6873 Bateman Field Dr
- 6877 Bateman Dell Way
- 1182 Bateman Ponds Way
- 6896 S Bateman Field Dr
- 6896 Bateman Field Dr
- 6863 S Bateman Field Dr