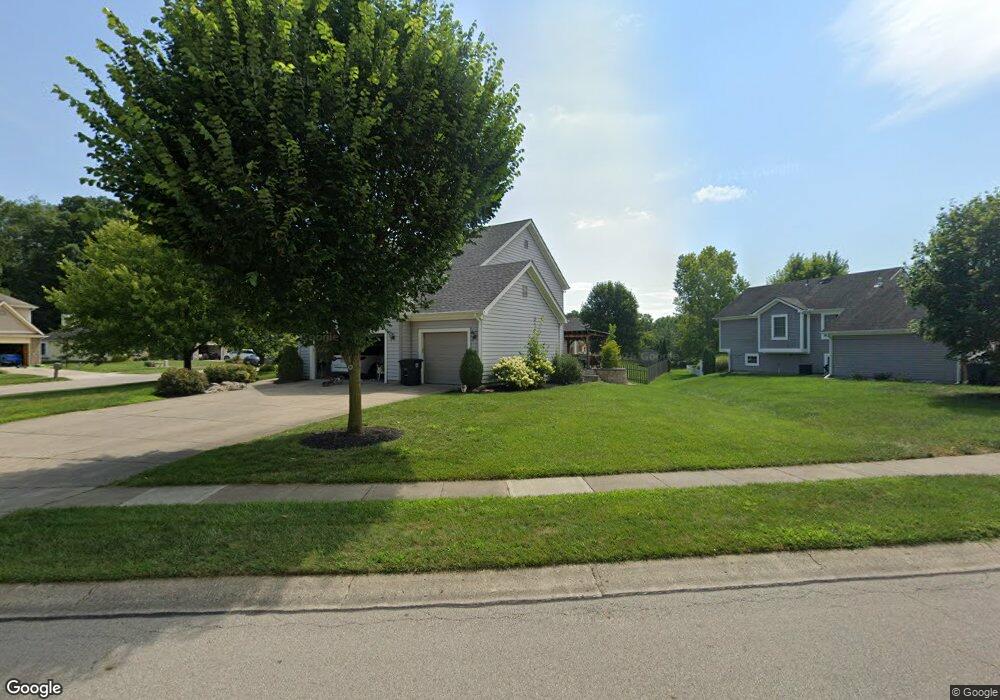
6896 Crossbrook Dr Dayton, OH 45459
Estimated Value: $463,875 - $519,000
5
Beds
4
Baths
3,113
Sq Ft
$159/Sq Ft
Est. Value
About This Home
This home is located at 6896 Crossbrook Dr, Dayton, OH 45459 and is currently estimated at $495,469, approximately $159 per square foot. 6896 Crossbrook Dr is a home located in Montgomery County with nearby schools including Primary Village North, Driscoll Elementary School, and Tower Heights Middle School.
Ownership History
Date
Name
Owned For
Owner Type
Purchase Details
Closed on
Aug 6, 2021
Sold by
Montgomery Derrick A
Bought by
Kinney Nicholas and Kinney Rebecca M
Current Estimated Value
Home Financials for this Owner
Home Financials are based on the most recent Mortgage that was taken out on this home.
Original Mortgage
$275,000
Outstanding Balance
$248,038
Interest Rate
2.8%
Mortgage Type
New Conventional
Estimated Equity
$247,431
Purchase Details
Closed on
Mar 28, 2014
Sold by
Fannie Mae
Bought by
Montgomery Derrick A
Home Financials for this Owner
Home Financials are based on the most recent Mortgage that was taken out on this home.
Original Mortgage
$193,800
Interest Rate
4.34%
Mortgage Type
Future Advance Clause Open End Mortgage
Purchase Details
Closed on
Jun 21, 2013
Sold by
Rosenberger Paul W
Bought by
Federal National Mortgage Association
Purchase Details
Closed on
May 17, 2013
Sold by
Rosenberger Paul W
Bought by
Federal National Mortgage Association
Create a Home Valuation Report for This Property
The Home Valuation Report is an in-depth analysis detailing your home's value as well as a comparison with similar homes in the area
Purchase History
| Date | Buyer | Sale Price | Title Company |
|---|---|---|---|
| Kinney Nicholas | $365,000 | M&M Title Co | |
| Montgomery Derrick A | -- | None Available | |
| Federal National Mortgage Association | $181,046 | None Available | |
| Federal National Mortgage Association | $181,046 | None Available |
Source: Public Records
Mortgage History
| Date | Status | Borrower | Loan Amount |
|---|---|---|---|
| Open | Kinney Nicholas | $275,000 | |
| Previous Owner | Montgomery Derrick A | $193,800 |
Source: Public Records
Tax History
| Year | Tax Paid | Tax Assessment Tax Assessment Total Assessment is a certain percentage of the fair market value that is determined by local assessors to be the total taxable value of land and additions on the property. | Land | Improvement |
|---|---|---|---|---|
| 2025 | $9,365 | $147,670 | $20,790 | $126,880 |
| 2024 | $8,563 | $147,670 | $20,790 | $126,880 |
| 2023 | $8,563 | $147,670 | $20,790 | $126,880 |
| 2022 | $8,179 | $111,870 | $15,750 | $96,120 |
| 2021 | $8,201 | $111,870 | $15,750 | $96,120 |
| 2020 | $8,367 | $111,870 | $15,750 | $96,120 |
| 2019 | $8,391 | $100,140 | $15,750 | $84,390 |
| 2018 | $6,577 | $88,290 | $15,750 | $72,540 |
| 2017 | $6,508 | $88,290 | $15,750 | $72,540 |
| 2016 | $6,358 | $81,400 | $15,750 | $65,650 |
| 2015 | $6,369 | $81,400 | $15,750 | $65,650 |
| 2014 | $6,294 | $81,400 | $15,750 | $65,650 |
| 2012 | -- | $78,040 | $17,500 | $60,540 |
Source: Public Records
Map
Nearby Homes
- 1953 Baldwin Dr
- 6673 Brigham Square
- 1914 Home Path Ct
- 6611 Brigham Square Unit 2
- 6521 Staverton Dr
- 6615 Hedington Square Unit 5
- 2520 Hingham Ln
- 1594 Mapleton Dr
- 6331 Adams Cir Unit 16
- 6640 Green Branch Dr Unit 7
- 6620 Green Branch Dr Unit 6
- 2585 Hingham Ln
- 6366 Jason Ln Unit 35
- 1413 Ashworth Ct Unit 1413
- 1311 Hollow Run Unit 6
- 1320 Glastonbury Ln Unit 28A1320
- 1366 Scenicview Ct
- 1547 Ambridge Rd
- 1237 Chevington Ct Unit 1515
- 1160 Smugglers Way Unit 1433
- 2018 Bluestream Ct
- 6908 Crossbrook Dr
- 2007 Bluestream Ct
- 1984 Crossbrook Dr
- 2034 Bluestream Ct
- 6932 Crossbrook Dr
- 2023 Bluestream Ct
- 6867 Crossbrook Dr
- 1987 Vista Oak Trail
- 2039 Bluestream Ct
- 2050 Bluestream Ct
- 1968 Vista Oak Trail
- 6915 Crossbrook Dr
- 6944 Crossbrook Dr
- 2055 Bluestream Ct
- 6927 Crossbrook Dr
- 1971 Vista Oak Trail
- 6956 Crossbrook Dr
- 6850 Marwyck Dr
- 2066 Bluestream Ct
Your Personal Tour Guide
Ask me questions while you tour the home.