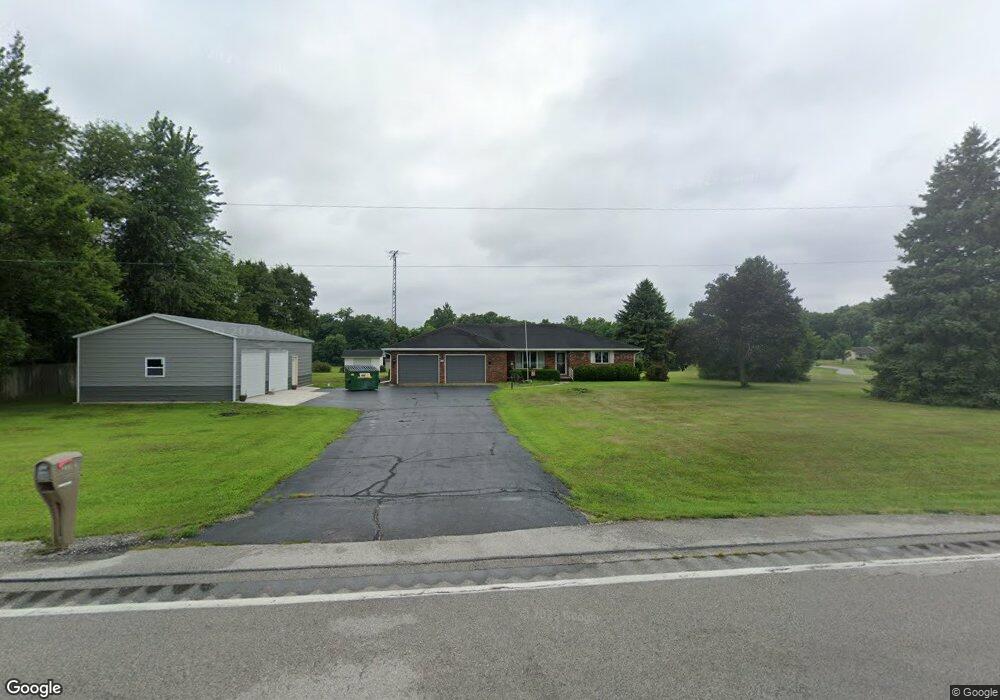
6896 E State Road 218 Camden, IN 46917
Estimated Value: $221,000 - $307,318
2
Beds
2
Baths
3,712
Sq Ft
$73/Sq Ft
Est. Value
About This Home
This home is located at 6896 E State Road 218, Camden, IN 46917 and is currently estimated at $272,080, approximately $73 per square foot. 6896 E State Road 218 is a home located in Carroll County with nearby schools including Carroll Elementary School and Carroll Senior High School.
Ownership History
Date
Name
Owned For
Owner Type
Purchase Details
Closed on
Mar 22, 2021
Sold by
Bird Stephanie L and Bryant Stephanie L
Bought by
Bird Stephanie L and Bird Eric
Current Estimated Value
Home Financials for this Owner
Home Financials are based on the most recent Mortgage that was taken out on this home.
Original Mortgage
$153,500
Outstanding Balance
$137,834
Interest Rate
2.8%
Mortgage Type
New Conventional
Estimated Equity
$134,246
Purchase Details
Closed on
Aug 2, 2017
Sold by
Long Kent A and Long Kimla
Bought by
Bryant Stephanie L
Home Financials for this Owner
Home Financials are based on the most recent Mortgage that was taken out on this home.
Original Mortgage
$157,102
Interest Rate
4.4%
Mortgage Type
FHA
Purchase Details
Closed on
Nov 25, 2015
Sold by
Huffman Charlotte L
Bought by
Long Kent A and Long Kimla
Purchase Details
Closed on
Dec 14, 2005
Sold by
Huffman Charlotte L and Myers Charlotte L
Bought by
Huffman Charlotte L and The Charlotte L Huffman Revocable Trust
Create a Home Valuation Report for This Property
The Home Valuation Report is an in-depth analysis detailing your home's value as well as a comparison with similar homes in the area
Purchase History
| Date | Buyer | Sale Price | Title Company |
|---|---|---|---|
| Bird Stephanie L | -- | Closing Usa Llc | |
| Bryant Stephanie L | -- | None Available | |
| Long Kent A | -- | None Available | |
| Huffman Charlotte L | -- | None Available |
Source: Public Records
Mortgage History
| Date | Status | Borrower | Loan Amount |
|---|---|---|---|
| Open | Bird Stephanie L | $153,500 | |
| Closed | Bryant Stephanie L | $157,102 |
Source: Public Records
Tax History
| Year | Tax Paid | Tax Assessment Tax Assessment Total Assessment is a certain percentage of the fair market value that is determined by local assessors to be the total taxable value of land and additions on the property. | Land | Improvement |
|---|---|---|---|---|
| 2025 | $1,169 | $249,300 | $23,800 | $225,500 |
| 2024 | $1,169 | $252,300 | $23,800 | $228,500 |
| 2023 | $1,088 | $252,500 | $23,800 | $228,700 |
| 2022 | $1,088 | $216,000 | $20,300 | $195,700 |
| 2021 | $808 | $163,100 | $20,300 | $142,800 |
| 2020 | $760 | $156,300 | $20,300 | $136,000 |
| 2019 | $1,599 | $156,300 | $20,300 | $136,000 |
| 2018 | $1,491 | $147,200 | $18,800 | $128,400 |
| 2017 | $247 | $28,500 | $18,800 | $9,700 |
| 2016 | $269 | $28,000 | $18,800 | $9,200 |
| 2014 | $460 | $121,200 | $17,800 | $103,400 |
Source: Public Records
Map
Nearby Homes
- 5782 E 750 N
- 12970 S 150 E
- 8560 S 200 E
- 9261 E 1061 S St
- 9969 S County Road 300 E
- 12205 W 350 N
- 4770 S 50 E Rd
- 2309 S 625 E
- 330 E Main St
- 8696 Burrows Rd
- 170 S Water St
- 342 W Cumberland St
- 239 E Main St
- 5378 E County Road 600 S
- 212 Brookview Ln
- 625 N State 75 Rd
- 6828 S 600 E
- 3520 S 500 E
- 6087 E State Road 218
- 121 W Walnut St
- 6896 E Sr 218
- 6882 E State Road 218
- 6942 E State Road 218
- 6971 E State Road 218
- 6971 E St Rd 218
- 6971 E Sr 218
- 6806 E State Road 218
- 6756 E State Road 218
- 6776 E State Road 218
- 4440 N State Road 29
- 4440 N St Rd 29
- 6738 E State Road 218
- 6738 E Sr 218
- 6710 E State Road 218
- 4446 N State Road 29
- 6684 E State Road 218
- 4451 N State Road 29
- 6662 E State Road 218
- 4513 N State Road 29
- 4534 N State Road 29
Your Personal Tour Guide
Ask me questions while you tour the home.