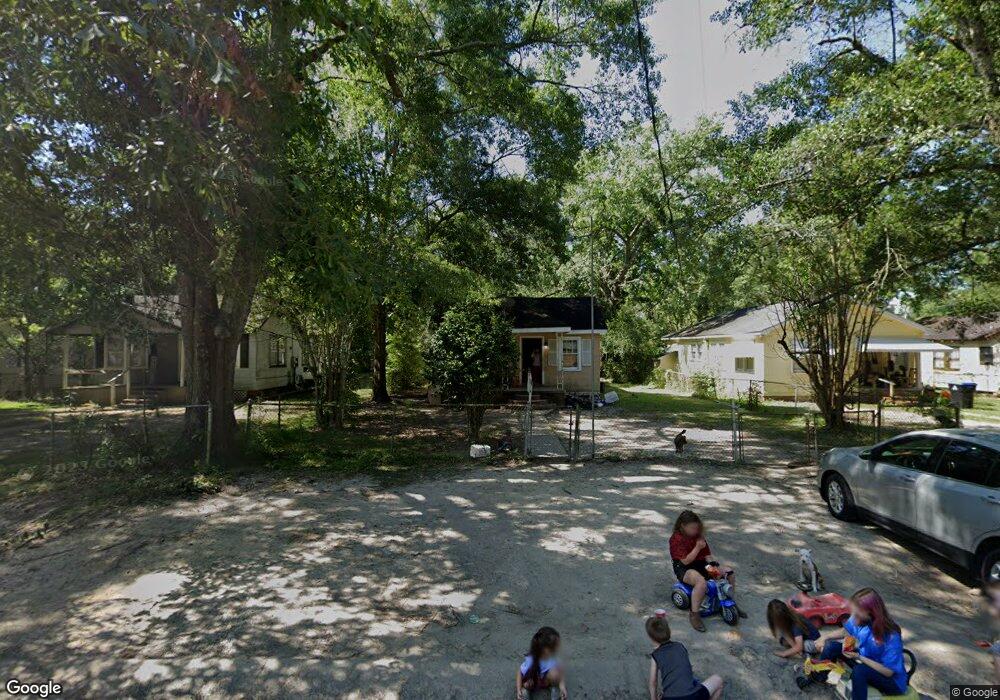
69 11th Ave Mobile, AL 36611
Estimated Value: $43,000 - $90,000
Studio
1
Bath
1,056
Sq Ft
$63/Sq Ft
Est. Value
About This Home
This home is located at 69 11th Ave, Mobile, AL 36611 and is currently estimated at $66,622, approximately $63 per square foot. 69 11th Ave is a home located in Mobile County with nearby schools including Chickasaw City Elementary School, Chickasaw City High School, and Prichard Preparatory School.
Ownership History
Date
Name
Owned For
Owner Type
Purchase Details
Closed on
Oct 2, 2023
Sold by
Trimax 2 Investments Llc
Bought by
Martinez Celis Luis A and Martinez Kristen Kristen
Current Estimated Value
Purchase Details
Closed on
Aug 6, 2008
Sold by
Haney Wayne and Mcguire Clyde
Bought by
Trimax 2 Investments Llc
Home Financials for this Owner
Home Financials are based on the most recent Mortgage that was taken out on this home.
Original Mortgage
$197,250
Interest Rate
6.43%
Mortgage Type
Unknown
Purchase Details
Closed on
Apr 15, 2004
Sold by
Adams Thomas J
Bought by
Haney Wayne and Mcguire Clyde
Create a Home Valuation Report for This Property
The Home Valuation Report is an in-depth analysis detailing your home's value as well as a comparison with similar homes in the area
Home Values in the Area
Average Home Value in this Area
Purchase History
| Date | Buyer | Sale Price | Title Company |
|---|---|---|---|
| Martinez Celis Luis A | $40,000 | None Listed On Document | |
| Trimax 2 Investments Llc | -- | Slt | |
| Haney Wayne | -- | -- |
Source: Public Records
Mortgage History
| Date | Status | Borrower | Loan Amount |
|---|---|---|---|
| Previous Owner | Trimax 2 Investments Llc | $197,250 |
Source: Public Records
Tax History
| Year | Tax Paid | Tax Assessment Tax Assessment Total Assessment is a certain percentage of the fair market value that is determined by local assessors to be the total taxable value of land and additions on the property. | Land | Improvement |
|---|---|---|---|---|
| 2025 | $382 | $6,580 | $1,200 | $5,380 |
| 2024 | $382 | $6,180 | $1,200 | $4,980 |
| 2023 | $280 | $5,240 | $1,200 | $4,040 |
| 2022 | $264 | $4,940 | $1,200 | $3,740 |
| 2021 | $244 | $4,560 | $1,100 | $3,460 |
| 2020 | $244 | $4,560 | $1,100 | $3,460 |
| 2019 | $225 | $4,200 | $1,120 | $3,080 |
| 2018 | $219 | $4,100 | $0 | $0 |
| 2017 | $217 | $4,100 | $0 | $0 |
| 2016 | $332 | $6,260 | $0 | $0 |
| 2013 | $512 | $9,040 | $0 | $0 |
Source: Public Records
Map
Nearby Homes
Your Personal Tour Guide
Ask me questions while you tour the home.