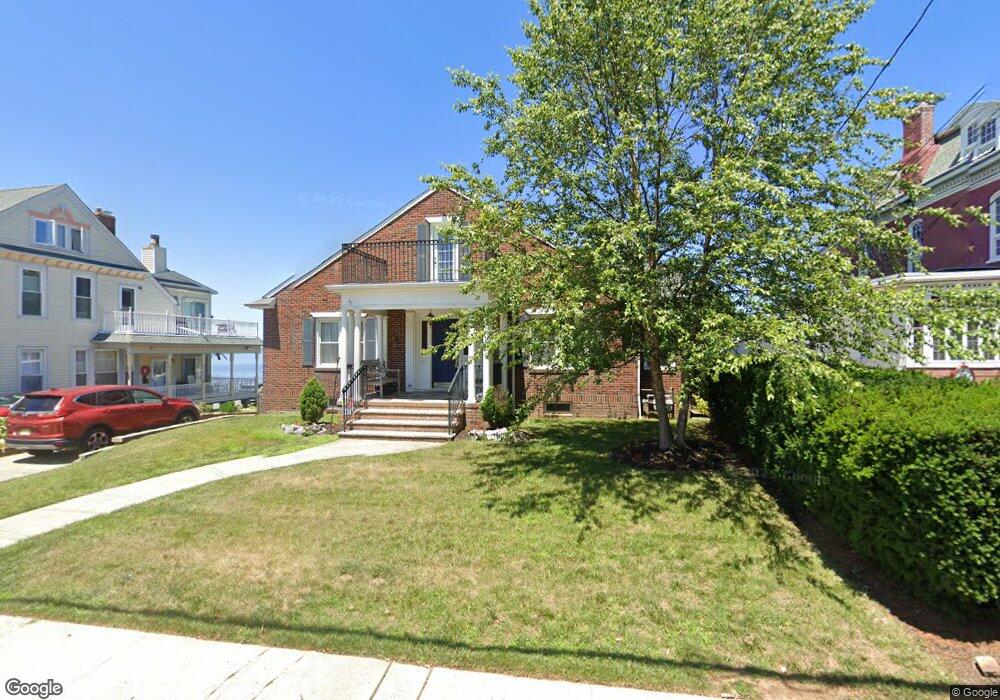
69 1st St Unit 1 Keyport, NJ 07735
Estimated Value: $901,000 - $1,031,000
2
Beds
1
Bath
1,100
Sq Ft
$882/Sq Ft
Est. Value
About This Home
This home is located at 69 1st St Unit 1, Keyport, NJ 07735 and is currently estimated at $970,151, approximately $881 per square foot. 69 1st St Unit 1 is a home located in Monmouth County with nearby schools including Keyport Central School, Keyport High School, and Icob Academy.
Ownership History
Date
Name
Owned For
Owner Type
Purchase Details
Closed on
Aug 5, 2015
Sold by
Us Bank Na
Bought by
Lemaitre Matthew T
Current Estimated Value
Home Financials for this Owner
Home Financials are based on the most recent Mortgage that was taken out on this home.
Original Mortgage
$400,000
Outstanding Balance
$315,025
Interest Rate
4.07%
Mortgage Type
Commercial
Estimated Equity
$655,126
Purchase Details
Closed on
May 7, 2013
Sold by
Arch Bay Holding Llc Series 2010 A
Bought by
U S Bank Na
Purchase Details
Closed on
Sep 27, 2005
Sold by
Raffo Peter
Bought by
Florentine Barbara
Home Financials for this Owner
Home Financials are based on the most recent Mortgage that was taken out on this home.
Original Mortgage
$300,000
Interest Rate
6.28%
Mortgage Type
Commercial
Create a Home Valuation Report for This Property
The Home Valuation Report is an in-depth analysis detailing your home's value as well as a comparison with similar homes in the area
Home Values in the Area
Average Home Value in this Area
Purchase History
| Date | Buyer | Sale Price | Title Company |
|---|---|---|---|
| Lemaitre Matthew T | $500,000 | Fidelity Nat Title Ins Co | |
| U S Bank Na | -- | None Available | |
| Florentine Barbara | $400,000 | -- |
Source: Public Records
Mortgage History
| Date | Status | Borrower | Loan Amount |
|---|---|---|---|
| Open | Lemaitre Matthew T | $400,000 | |
| Previous Owner | Florentine Barbara | $300,000 |
Source: Public Records
Tax History Compared to Growth
Tax History
| Year | Tax Paid | Tax Assessment Tax Assessment Total Assessment is a certain percentage of the fair market value that is determined by local assessors to be the total taxable value of land and additions on the property. | Land | Improvement |
|---|---|---|---|---|
| 2025 | $19,891 | $1,042,200 | $379,500 | $662,700 |
| 2024 | $20,457 | $960,900 | $330,800 | $630,100 |
| 2023 | $20,457 | $930,700 | $301,200 | $629,500 |
| 2022 | $16,094 | $789,400 | $242,200 | $547,200 |
| 2021 | $16,094 | $637,700 | $254,300 | $383,400 |
| 2020 | $15,479 | $608,700 | $244,100 | $364,600 |
| 2019 | $14,066 | $554,000 | $197,700 | $356,300 |
| 2018 | $13,809 | $531,100 | $197,700 | $333,400 |
| 2017 | $14,435 | $553,700 | $197,700 | $356,000 |
| 2016 | $13,969 | $540,400 | $197,700 | $342,700 |
| 2015 | $13,798 | $531,300 | $193,200 | $338,100 |
| 2014 | $17,963 | $698,400 | $335,400 | $363,000 |
Source: Public Records
Map
Nearby Homes