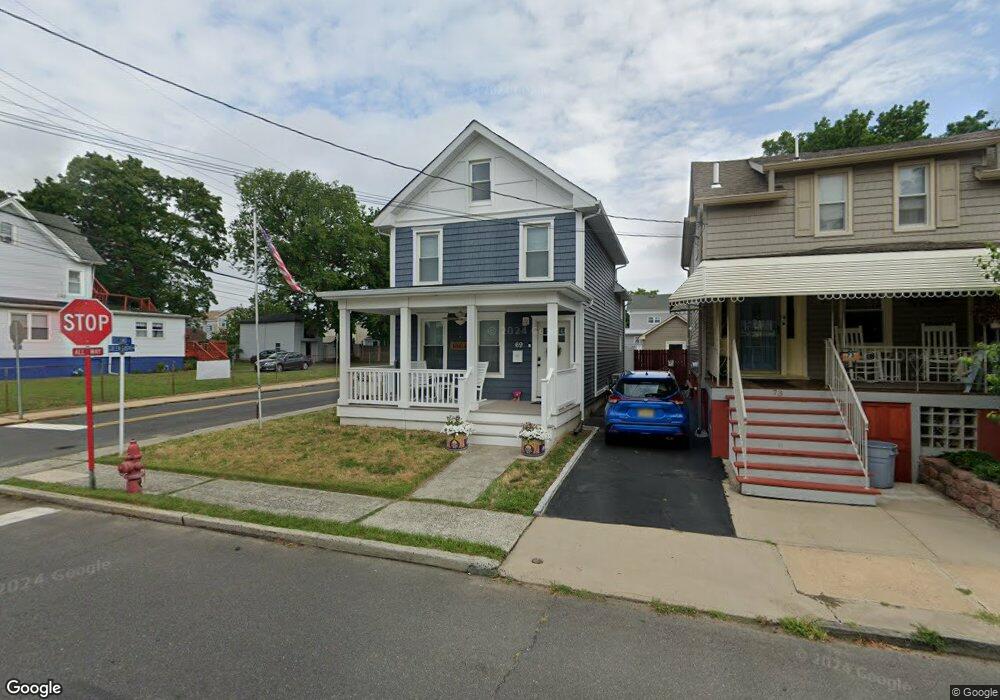
69 2nd St Keyport, NJ 07735
Estimated Value: $384,000 - $448,000
3
Beds
1
Bath
1,342
Sq Ft
$309/Sq Ft
Est. Value
About This Home
This home is located at 69 2nd St, Keyport, NJ 07735 and is currently estimated at $414,476, approximately $308 per square foot. 69 2nd St is a home located in Monmouth County with nearby schools including Keyport Central School, Keyport High School, and Icob Academy.
Ownership History
Date
Name
Owned For
Owner Type
Purchase Details
Closed on
Dec 14, 2021
Sold by
Christine Christie
Bought by
Merla Andrew and Merla Del Buono
Current Estimated Value
Home Financials for this Owner
Home Financials are based on the most recent Mortgage that was taken out on this home.
Original Mortgage
$266,000
Outstanding Balance
$243,946
Interest Rate
3.05%
Mortgage Type
New Conventional
Estimated Equity
$170,530
Purchase Details
Closed on
Oct 26, 1979
Bought by
Christie Geoffrey T and Christie Christine
Create a Home Valuation Report for This Property
The Home Valuation Report is an in-depth analysis detailing your home's value as well as a comparison with similar homes in the area
Home Values in the Area
Average Home Value in this Area
Purchase History
| Date | Buyer | Sale Price | Title Company |
|---|---|---|---|
| Merla Andrew | $280,000 | Foundation Title | |
| Christie Geoffrey T | $35,000 | -- |
Source: Public Records
Mortgage History
| Date | Status | Borrower | Loan Amount |
|---|---|---|---|
| Open | Merla Andrew | $266,000 |
Source: Public Records
Tax History Compared to Growth
Tax History
| Year | Tax Paid | Tax Assessment Tax Assessment Total Assessment is a certain percentage of the fair market value that is determined by local assessors to be the total taxable value of land and additions on the property. | Land | Improvement |
|---|---|---|---|---|
| 2025 | $6,694 | $415,300 | $196,300 | $219,000 |
| 2024 | $6,581 | $323,400 | $169,300 | $154,100 |
| 2023 | $6,581 | $299,400 | $153,900 | $145,500 |
| 2022 | $5,640 | $260,300 | $133,800 | $126,500 |
| 2021 | $5,640 | $241,000 | $123,900 | $117,100 |
| 2020 | $5,864 | $230,600 | $119,200 | $111,400 |
| 2019 | $5,667 | $223,200 | $114,700 | $108,500 |
| 2018 | $5,070 | $195,000 | $93,500 | $101,500 |
| 2017 | $4,985 | $191,200 | $91,000 | $100,200 |
| 2016 | $4,813 | $186,200 | $91,000 | $95,200 |
| 2015 | $4,607 | $177,400 | $83,500 | $93,900 |
| 2014 | $4,190 | $162,900 | $58,500 | $104,400 |
Source: Public Records
Map
Nearby Homes