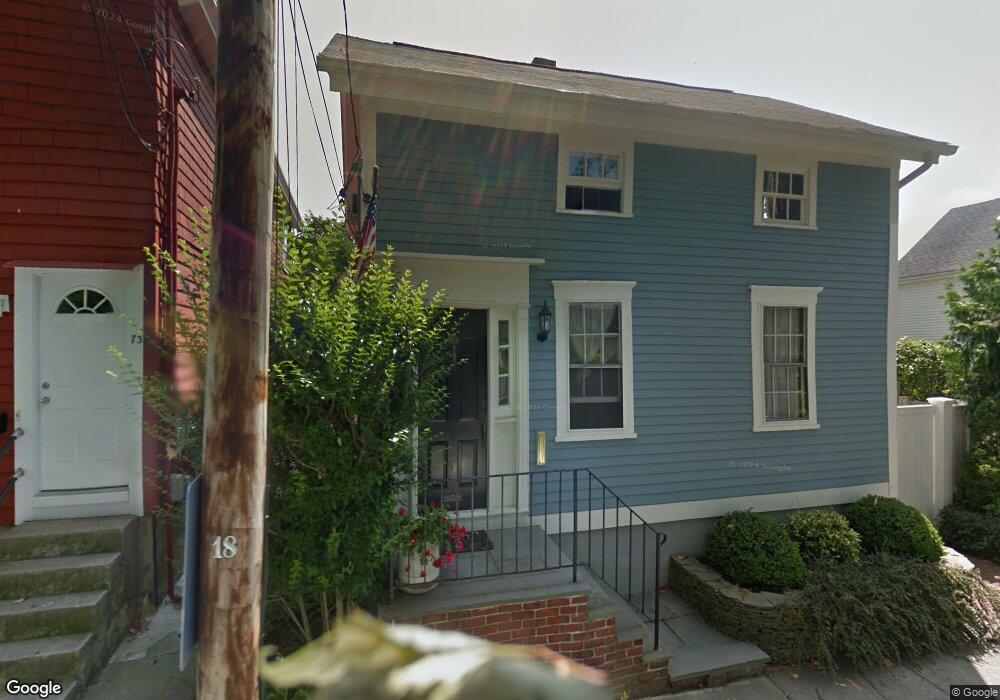
69 2nd St Newport, RI 02840
Estimated Value: $863,000 - $1,018,000
3
Beds
2
Baths
1,271
Sq Ft
$753/Sq Ft
Est. Value
About This Home
This home is located at 69 2nd St, Newport, RI 02840 and is currently estimated at $957,485, approximately $753 per square foot. 69 2nd St is a home located in Newport County with nearby schools including Rogers High School, St Michael's Country Day School, and St George's School.
Ownership History
Date
Name
Owned For
Owner Type
Purchase Details
Closed on
May 7, 2025
Sold by
Kristiansson Andrew C
Bought by
Andrew C Kristiansson Rel C and Andrew Kristiansson
Current Estimated Value
Purchase Details
Closed on
Dec 17, 1999
Sold by
Hasse Gladys Est
Bought by
Kristiansson Andrew C
Create a Home Valuation Report for This Property
The Home Valuation Report is an in-depth analysis detailing your home's value as well as a comparison with similar homes in the area
Home Values in the Area
Average Home Value in this Area
Purchase History
| Date | Buyer | Sale Price | Title Company |
|---|---|---|---|
| Andrew C Kristiansson Rel C | -- | None Available | |
| Andrew C Kristiansson Rel C | -- | None Available | |
| Kristiansson Andrew C | $172,000 | -- | |
| Kristiansson Andrew C | $172,000 | -- |
Source: Public Records
Mortgage History
| Date | Status | Borrower | Loan Amount |
|---|---|---|---|
| Previous Owner | Kristiansson Andrew C | $85,000 | |
| Previous Owner | Kristiansson Andrew C | $97,500 | |
| Previous Owner | Kristiansson Andrew C | $10,000 |
Source: Public Records
Tax History Compared to Growth
Tax History
| Year | Tax Paid | Tax Assessment Tax Assessment Total Assessment is a certain percentage of the fair market value that is determined by local assessors to be the total taxable value of land and additions on the property. | Land | Improvement |
|---|---|---|---|---|
| 2025 | $6,213 | $865,300 | $416,300 | $449,000 |
| 2024 | $6,031 | $865,300 | $416,300 | $449,000 |
| 2023 | $6,108 | $615,700 | $274,000 | $341,700 |
| 2022 | $5,917 | $615,700 | $274,000 | $341,700 |
| 2021 | $5,744 | $615,700 | $274,000 | $341,700 |
| 2020 | $5,896 | $573,500 | $276,900 | $296,600 |
| 2019 | $5,896 | $573,500 | $276,900 | $296,600 |
| 2018 | $5,729 | $573,500 | $276,900 | $296,600 |
| 2017 | $5,263 | $469,500 | $213,000 | $256,500 |
| 2016 | $5,132 | $469,500 | $213,000 | $256,500 |
| 2015 | $5,010 | $469,500 | $213,000 | $256,500 |
| 2014 | $5,142 | $426,400 | $166,500 | $259,900 |
Source: Public Records
Map
Nearby Homes