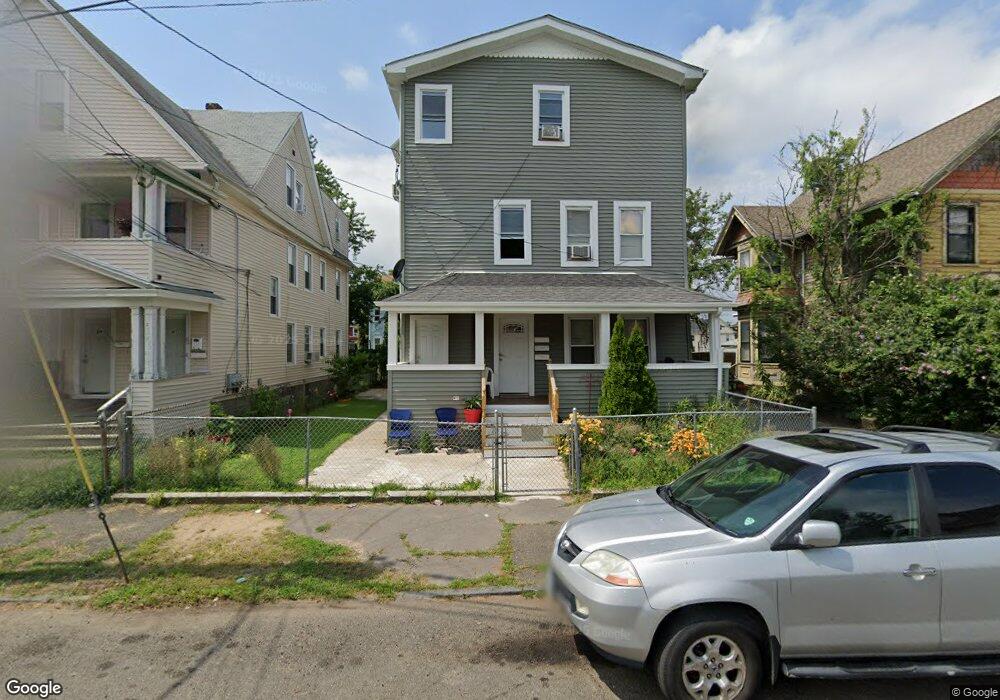
69 5th St Bridgeport, CT 06607
East End NeighborhoodEstimated Value: $305,000 - $446,000
6
Beds
2
Baths
2,681
Sq Ft
$142/Sq Ft
Est. Value
About This Home
This home is located at 69 5th St, Bridgeport, CT 06607 and is currently estimated at $381,753, approximately $142 per square foot. 69 5th St is a home located in Fairfield County with nearby schools including Dunbar School, Harding High School, and Capital Prep Harbor Upper School.
Ownership History
Date
Name
Owned For
Owner Type
Purchase Details
Closed on
Sep 9, 2010
Sold by
Us Bk
Bought by
Lopez Segundo A and Cabrera Maria Rosario
Current Estimated Value
Purchase Details
Closed on
Feb 1, 2010
Sold by
Nelson Lynton
Bought by
Us Bk
Purchase Details
Closed on
Sep 5, 2006
Sold by
Murphy Ruby and Murphy Ebony
Bought by
Nelson Lynton
Home Financials for this Owner
Home Financials are based on the most recent Mortgage that was taken out on this home.
Original Mortgage
$173,844
Interest Rate
9.99%
Purchase Details
Closed on
Jun 19, 1995
Sold by
Ford Consumer Fin Co
Bought by
Murphy Ruby and Jones Ben
Purchase Details
Closed on
Oct 17, 1994
Sold by
King Dana
Bought by
Drakeford Dwight L
Purchase Details
Closed on
Jun 20, 1994
Sold by
Peoples Bk
Bought by
King Dana
Create a Home Valuation Report for This Property
The Home Valuation Report is an in-depth analysis detailing your home's value as well as a comparison with similar homes in the area
Home Values in the Area
Average Home Value in this Area
Purchase History
| Date | Buyer | Sale Price | Title Company |
|---|---|---|---|
| Lopez Segundo A | $36,000 | -- | |
| Lopez Segundo A | $36,000 | -- | |
| Us Bk | -- | -- | |
| Us Bk | -- | -- | |
| Nelson Lynton | $193,160 | -- | |
| Nelson Lynton | $193,160 | -- | |
| Murphy Ruby | $24,900 | -- | |
| Murphy Ruby | $24,900 | -- | |
| Drakeford Dwight L | $70,000 | -- | |
| Drakeford Dwight L | $70,000 | -- | |
| King Dana | $10,000 | -- | |
| King Dana | $10,000 | -- |
Source: Public Records
Mortgage History
| Date | Status | Borrower | Loan Amount |
|---|---|---|---|
| Previous Owner | King Dana | $173,844 |
Source: Public Records
Tax History
| Year | Tax Paid | Tax Assessment Tax Assessment Total Assessment is a certain percentage of the fair market value that is determined by local assessors to be the total taxable value of land and additions on the property. | Land | Improvement |
|---|---|---|---|---|
| 2025 | $6,852 | $157,700 | $32,820 | $124,880 |
| 2024 | $6,852 | $157,700 | $32,820 | $124,880 |
| 2023 | $6,475 | $149,030 | $32,820 | $116,210 |
| 2022 | $6,475 | $149,030 | $32,820 | $116,210 |
| 2021 | $6,475 | $149,030 | $32,820 | $116,210 |
| 2020 | $6,132 | $113,570 | $18,360 | $95,210 |
| 2019 | $6,132 | $113,570 | $18,360 | $95,210 |
| 2018 | $6,175 | $113,570 | $18,360 | $95,210 |
| 2017 | $6,175 | $113,570 | $18,360 | $95,210 |
| 2016 | $6,175 | $113,570 | $18,360 | $95,210 |
| 2015 | $6,436 | $152,500 | $31,470 | $121,030 |
| 2014 | $6,436 | $152,500 | $31,470 | $121,030 |
Source: Public Records
Map
Nearby Homes
- 40 5th St
- 93 Clifford St
- 643 Newfield Ave Unit 645
- 179 4th St
- 239 Beardsley St Unit 241
- 247 6th St
- 221 Bunnell St
- 520 Seaview Ave
- 188 Holly St
- 363 Carroll Ave Unit 365
- 800 Seaview Ave Unit 770-5
- 610 Wilmot Ave Unit 4
- 306 Carroll Ave
- 1440 Stratford Ave
- 464 Wilmot Ave
- 445 Nichols St
- 98 Carroll Ave Unit 100
- 102 Carroll Ave
- 60 Gilmore St Unit 21
- 202 Hewitt St
Your Personal Tour Guide
Ask me questions while you tour the home.