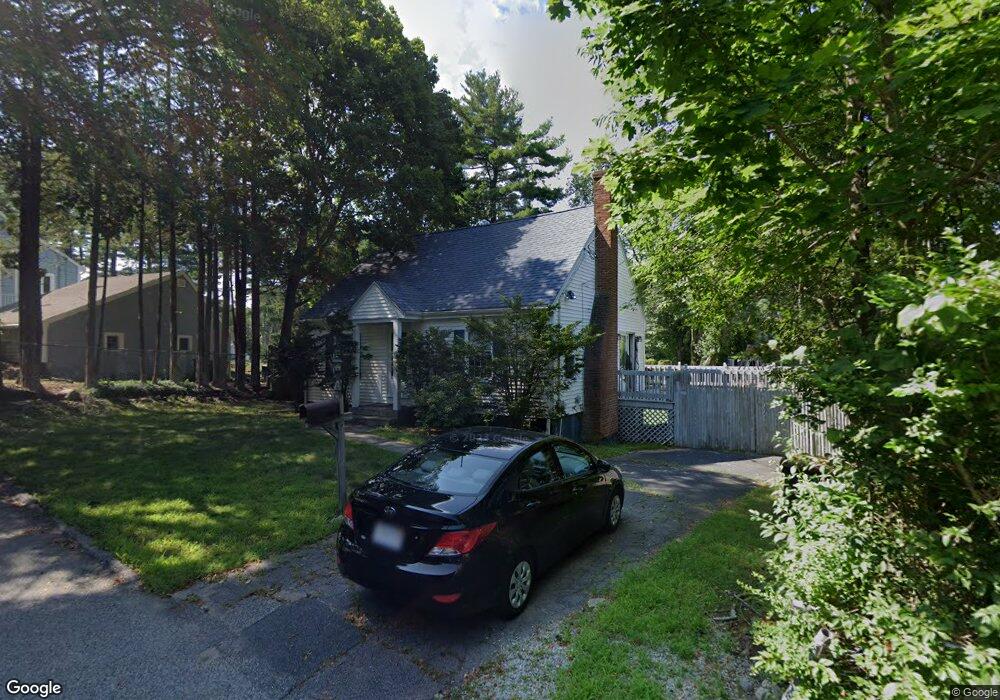
69 Adams Place South Weymouth, MA 02190
South Weymouth NeighborhoodEstimated Value: $624,133 - $658,000
4
Beds
2
Baths
1,365
Sq Ft
$471/Sq Ft
Est. Value
About This Home
This home is located at 69 Adams Place, South Weymouth, MA 02190 and is currently estimated at $643,533, approximately $471 per square foot. 69 Adams Place is a home located in Norfolk County with nearby schools including Thomas V Nash, Abigail Adams Middle School, and Weymouth Middle School Chapman.
Ownership History
Date
Name
Owned For
Owner Type
Purchase Details
Closed on
Sep 24, 2004
Sold by
Pance Genci
Bought by
Brennan Stephen R
Current Estimated Value
Purchase Details
Closed on
Mar 12, 2004
Sold by
Strungis Laurie and Strungis Mark
Bought by
Pance Genci
Purchase Details
Closed on
Aug 1, 2001
Sold by
Downey Leo J and Downey Cathy J
Bought by
Strungis Mark and Strungis Laurie
Create a Home Valuation Report for This Property
The Home Valuation Report is an in-depth analysis detailing your home's value as well as a comparison with similar homes in the area
Home Values in the Area
Average Home Value in this Area
Purchase History
| Date | Buyer | Sale Price | Title Company |
|---|---|---|---|
| Brennan Stephen R | $355,000 | -- | |
| Pance Genci | $71,500 | -- | |
| Strungis Mark | $245,000 | -- |
Source: Public Records
Mortgage History
| Date | Status | Borrower | Loan Amount |
|---|---|---|---|
| Open | Strungis Mark | $257,000 | |
| Closed | Strungis Mark | $260,000 |
Source: Public Records
Tax History Compared to Growth
Tax History
| Year | Tax Paid | Tax Assessment Tax Assessment Total Assessment is a certain percentage of the fair market value that is determined by local assessors to be the total taxable value of land and additions on the property. | Land | Improvement |
|---|---|---|---|---|
| 2025 | $4,979 | $493,000 | $199,700 | $293,300 |
| 2024 | $4,632 | $451,000 | $190,200 | $260,800 |
| 2023 | $4,549 | $435,300 | $193,700 | $241,600 |
| 2022 | $4,445 | $387,900 | $179,400 | $208,500 |
| 2021 | $4,174 | $355,500 | $179,400 | $176,100 |
| 2020 | $3,969 | $333,000 | $179,400 | $153,600 |
| 2019 | $3,905 | $322,200 | $172,500 | $149,700 |
| 2018 | $3,726 | $298,100 | $156,800 | $141,300 |
| 2017 | $3,668 | $286,300 | $149,300 | $137,000 |
| 2016 | $3,583 | $279,900 | $143,600 | $136,300 |
| 2015 | $3,453 | $267,700 | $143,600 | $124,100 |
| 2014 | $3,297 | $247,900 | $133,600 | $114,300 |
Source: Public Records
Map
Nearby Homes
- 27 Park Ave
- 2 Mitchell Ln Unit B
- 24 Fisher Rd
- 16 Jay Rd
- 92 Mercury St
- 308 Forest St
- 120 Randolph St
- 45 Union St
- 261 Pleasant St Unit 3
- 261 Pleasant St Unit 5
- 18 Fountain Ln Unit 2
- 50 Hollis St
- 262 West St
- 193 Randolph St
- 255 West St
- 68 Massapoag St Unit 7
- 211 Randolph St
- 120 Burkhall St Unit K
- 25 Wales Ave
- 60 Greentree Ln Unit 38