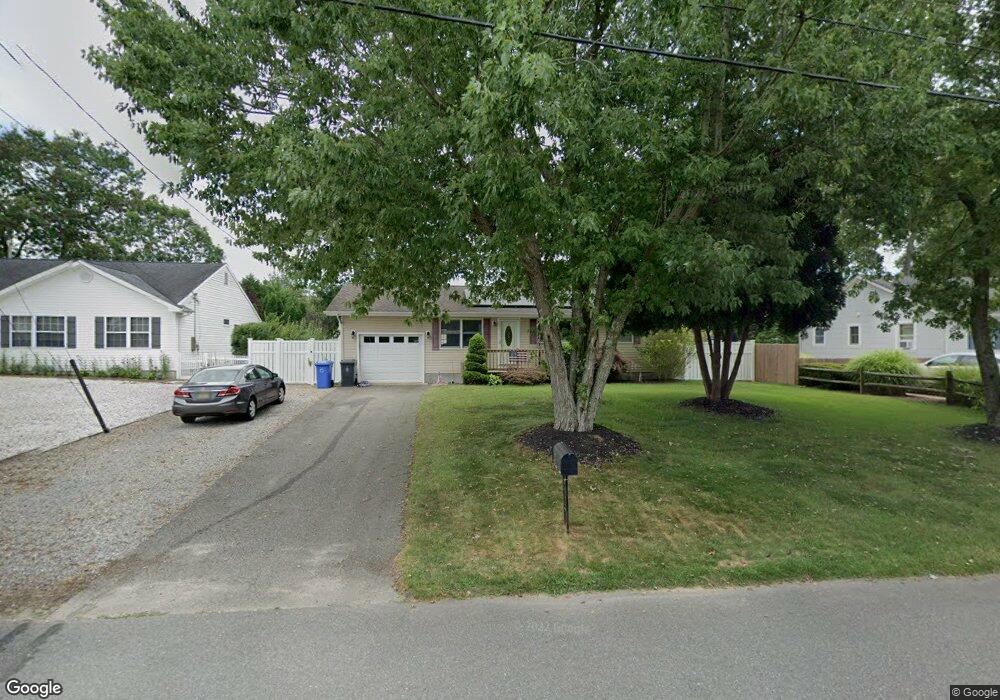
69 Anchor Ave Manahawkin, NJ 08050
Stafford NeighborhoodEstimated Value: $420,924 - $467,000
3
Beds
2
Baths
1,400
Sq Ft
$317/Sq Ft
Est. Value
About This Home
This home is located at 69 Anchor Ave, Manahawkin, NJ 08050 and is currently estimated at $443,731, approximately $316 per square foot. 69 Anchor Ave is a home located in Ocean County with nearby schools including Ocean Acres Elementary School, Oxycocus Elementary School, and McKinley Avenue Elementary School.
Ownership History
Date
Name
Owned For
Owner Type
Purchase Details
Closed on
May 16, 2009
Sold by
Benavitch Faith
Bought by
Poplawski April A
Current Estimated Value
Home Financials for this Owner
Home Financials are based on the most recent Mortgage that was taken out on this home.
Original Mortgage
$245,450
Outstanding Balance
$155,081
Interest Rate
4.85%
Mortgage Type
FHA
Estimated Equity
$288,650
Purchase Details
Closed on
Feb 23, 2007
Sold by
Southwinds Development Group Inc
Bought by
Benavitch Faith
Purchase Details
Closed on
Feb 15, 2007
Sold by
Sturiale Judith
Bought by
Southwinds Development Group Inc
Purchase Details
Closed on
Sep 9, 1999
Sold by
Bonanno Richard H and Bonanno Phyllis L
Bought by
Sturiale Anthony and Sturiale Judith
Home Financials for this Owner
Home Financials are based on the most recent Mortgage that was taken out on this home.
Original Mortgage
$89,900
Interest Rate
8.1%
Mortgage Type
FHA
Create a Home Valuation Report for This Property
The Home Valuation Report is an in-depth analysis detailing your home's value as well as a comparison with similar homes in the area
Home Values in the Area
Average Home Value in this Area
Purchase History
| Date | Buyer | Sale Price | Title Company |
|---|---|---|---|
| Poplawski April A | $250,000 | Stewart Title Guaranty Co | |
| Benavitch Faith | -- | Transnation Title Ins Co | |
| Southwinds Development Group Inc | $180,000 | Transnation Title Ins Co | |
| Sturiale Anthony | $90,000 | Fidelity National Title Ins |
Source: Public Records
Mortgage History
| Date | Status | Borrower | Loan Amount |
|---|---|---|---|
| Open | Poplawski April A | $245,450 | |
| Previous Owner | Sturiale Anthony | $89,900 |
Source: Public Records
Tax History Compared to Growth
Tax History
| Year | Tax Paid | Tax Assessment Tax Assessment Total Assessment is a certain percentage of the fair market value that is determined by local assessors to be the total taxable value of land and additions on the property. | Land | Improvement |
|---|---|---|---|---|
| 2025 | $4,194 | $168,900 | $61,600 | $107,300 |
| 2024 | $4,153 | $168,900 | $61,600 | $107,300 |
| 2023 | $3,976 | $168,900 | $61,600 | $107,300 |
| 2022 | $3,976 | $168,900 | $61,600 | $107,300 |
| 2021 | $3,922 | $168,900 | $61,600 | $107,300 |
| 2020 | $3,908 | $168,100 | $61,600 | $106,500 |
| 2019 | $3,853 | $168,100 | $61,600 | $106,500 |
| 2018 | $3,829 | $168,100 | $61,600 | $106,500 |
| 2017 | $3,638 | $154,600 | $61,600 | $93,000 |
| 2016 | $3,601 | $154,600 | $61,600 | $93,000 |
| 2015 | $3,474 | $154,600 | $61,600 | $93,000 |
| 2014 | $3,433 | $150,900 | $60,800 | $90,100 |
Source: Public Records
Map
Nearby Homes
- 1015 Barnacle Dr
- 117 Inlet Ave
- 140 Riptide Ave
- 135 Nautilus Dr
- 1173 Barnacle Dr
- 937 Sandy Cir
- 106 Bryce Ln Unit 802
- 55 Bryce Ln Unit 1408
- 1195 Windlass Dr
- 3 Bryce Ln Unit 1502
- 3 Bryce Ln
- 1014 Clearwater Ave
- 1174 Steamer Ave
- 1208 Windlass Dr
- 248 Matey Ave
- 26 Osprey Ave
- 1215 Canal Ave
- 1073 Cutlass Ave
- 155 Corliss Way
- 296 Nautilus Dr
- 73 Anchor Ave
- 65 Anchor Ave
- 998 Whispering Oak Ln
- 994 Whispering Oak Ln
- 77 Anchor Ave
- 61 Anchor Ave
- 1002 Whispering Oak Ln
- 977 Starboard Ave
- 990 Whispering Oak Ln
- 74 Anchor Ave
- 60 Anchor Ave
- 1006 Whispering Oak Ln
- 57 Anchor Ave
- 81 Anchor Ave
- 986 Whispering Oak Ln
- 56 Anchor Ave
- 80 Anchor Ave
- 61 Crest Ave
- 102 Hollow Oak Ln
- 1010 Whispering Oak Ln