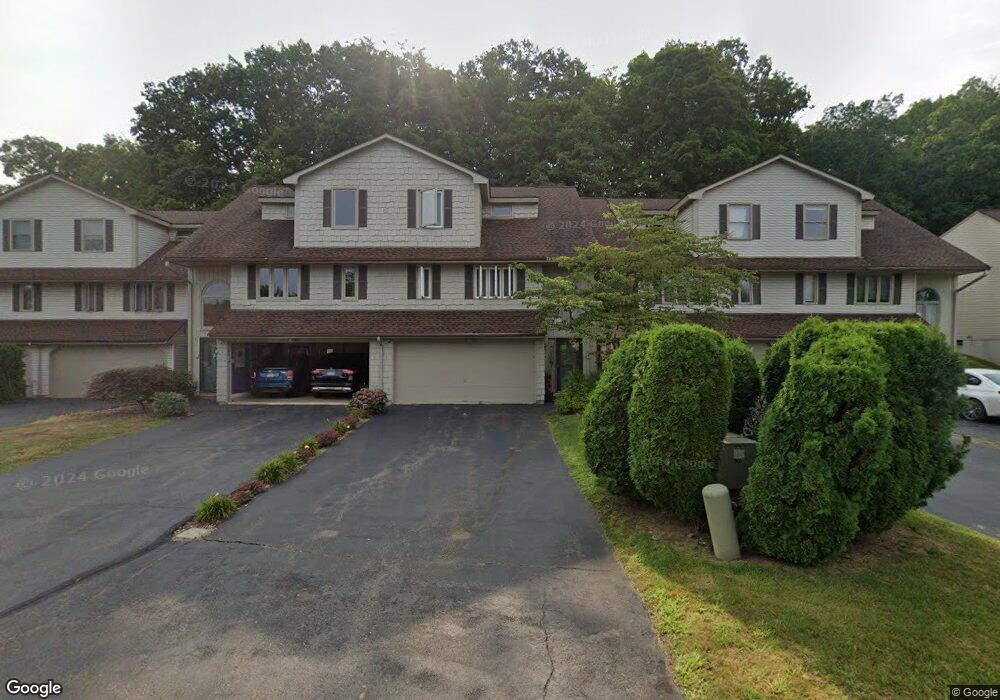
69 Apple Hill Newington, CT 06111
Estimated Value: $305,789 - $343,000
2
Beds
3
Baths
1,235
Sq Ft
$267/Sq Ft
Est. Value
About This Home
This home is located at 69 Apple Hill, Newington, CT 06111 and is currently estimated at $330,197, approximately $267 per square foot. 69 Apple Hill is a home located in Hartford County with nearby schools including Ruth Chaffee School, John Wallace Middle School, and Newington High School.
Ownership History
Date
Name
Owned For
Owner Type
Purchase Details
Closed on
Apr 30, 2018
Sold by
Lantiere Dawn C
Bought by
Pisarski Emilia
Current Estimated Value
Home Financials for this Owner
Home Financials are based on the most recent Mortgage that was taken out on this home.
Original Mortgage
$50,000
Outstanding Balance
$29,389
Interest Rate
4.44%
Mortgage Type
Purchase Money Mortgage
Estimated Equity
$300,808
Purchase Details
Closed on
Aug 24, 2012
Sold by
Rucci Gerald F and Corso Karen R
Bought by
Lantiere Dawn C
Home Financials for this Owner
Home Financials are based on the most recent Mortgage that was taken out on this home.
Original Mortgage
$157,125
Interest Rate
3.61%
Purchase Details
Closed on
Nov 13, 1990
Sold by
Jh Scelza Inc
Bought by
Bongo Paul
Home Financials for this Owner
Home Financials are based on the most recent Mortgage that was taken out on this home.
Original Mortgage
$105,000
Interest Rate
10.12%
Create a Home Valuation Report for This Property
The Home Valuation Report is an in-depth analysis detailing your home's value as well as a comparison with similar homes in the area
Home Values in the Area
Average Home Value in this Area
Purchase History
| Date | Buyer | Sale Price | Title Company |
|---|---|---|---|
| Pisarski Emilia | $205,000 | -- | |
| Lantiere Dawn C | $207,500 | -- | |
| Bongo Paul | $152,900 | -- |
Source: Public Records
Mortgage History
| Date | Status | Borrower | Loan Amount |
|---|---|---|---|
| Open | Pisarski Emilia | $50,000 | |
| Previous Owner | Lantiere Dawn C | $157,125 | |
| Previous Owner | Bongo Paul | $105,000 |
Source: Public Records
Tax History Compared to Growth
Tax History
| Year | Tax Paid | Tax Assessment Tax Assessment Total Assessment is a certain percentage of the fair market value that is determined by local assessors to be the total taxable value of land and additions on the property. | Land | Improvement |
|---|---|---|---|---|
| 2025 | $5,696 | $142,480 | $0 | $142,480 |
| 2024 | $5,393 | $135,940 | $0 | $135,940 |
| 2023 | $5,215 | $135,940 | $0 | $135,940 |
| 2022 | $5,232 | $135,940 | $0 | $135,940 |
| 2021 | $5,276 | $135,940 | $0 | $135,940 |
| 2020 | $5,490 | $139,760 | $0 | $139,760 |
| 2019 | $5,514 | $139,760 | $0 | $139,760 |
| 2018 | $5,381 | $139,760 | $0 | $139,760 |
| 2017 | $5,114 | $139,760 | $0 | $139,760 |
| 2016 | $4,996 | $139,760 | $0 | $139,760 |
| 2014 | $4,888 | $140,570 | $0 | $140,570 |
Source: Public Records
Map
Nearby Homes
- 78 Apple Hill
- 9 Coachmen Ln
- 19 Sunnybrook Dr
- 53 Salem Dr
- 24 Pine Meadow Rd
- 409 Carlton Ln Unit 409
- 18 Stone Hill Dr
- 43 Steeplechase Dr Unit 43
- 221 Westmeadow Rd
- 660/674 Church Rear St
- 31 Woodsedge Dr Unit 1C
- 120 Fox Run Ct
- 107 Fox Run Ct Unit 107
- 149 Foxboro Dr Unit 149
- 31 Fox Run Ct Unit 31
- 263 Two Rod Hwy
- 124 Speno Ridge
- 39 Pepper Bush Ln
- 326 France St
- 516 Wethersfield Rd
- 69 Apple Hill Unit 69
- 67 Apple Hill
- 71 Apple Hill
- 65 Apple Hill
- 65 Apple Hill Unit 65
- 75 Apple Hill
- 77 Apple Hill
- 77 Apple Hill Unit 77
- 61 Apple Hill
- 59 Apple Hill
- 59 Apple Hill Unit 59
- 81 Apple Hill
- 35 Coachmen Ln
- 57 Apple Hill
- 57 Apple Hill Unit 57
- 83 Apple Hill
- 83 Apple Hill Unit 39
- 66 Apple Hill
- 68 Apple Hill