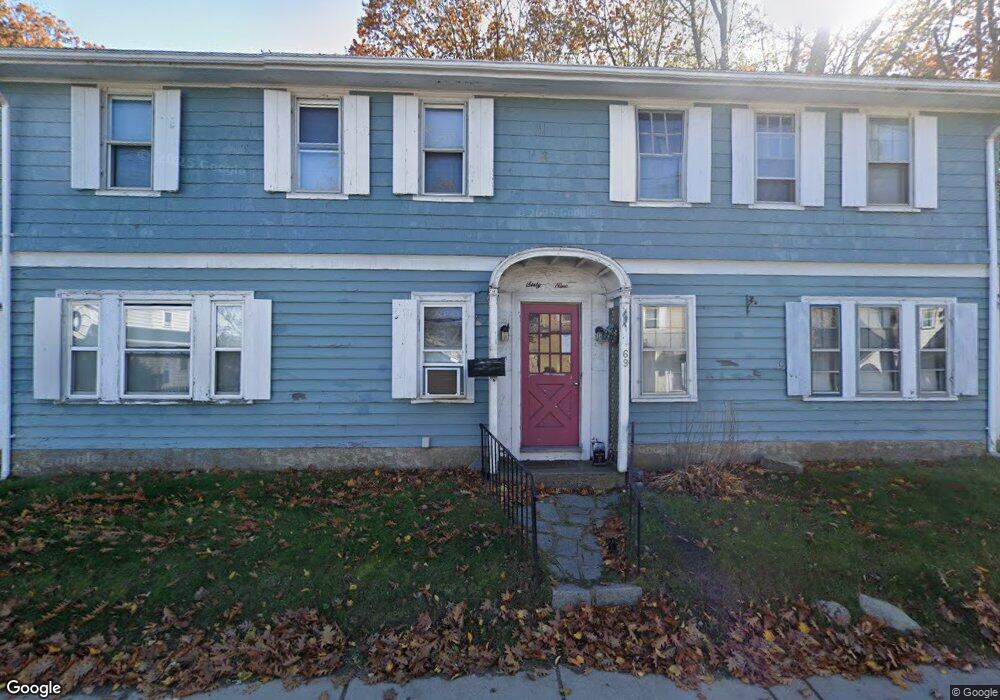
69 Bass Ave Unit 2 Gloucester, MA 01930
East Gloucester NeighborhoodEstimated Value: $721,393 - $821,000
3
Beds
1
Bath
1,204
Sq Ft
$633/Sq Ft
Est. Value
About This Home
This home is located at 69 Bass Ave Unit 2, Gloucester, MA 01930 and is currently estimated at $762,098, approximately $632 per square foot. 69 Bass Ave Unit 2 is a home located in Essex County with nearby schools including East Gloucester Elementary School, Ralph B O'maley Middle School, and Faith Christian School.
Ownership History
Date
Name
Owned For
Owner Type
Purchase Details
Closed on
Jan 18, 2022
Sold by
Russell Curtis J and Vanderwerken Stephen J
Bought by
Difiore Ellen and Difiore Luke
Current Estimated Value
Home Financials for this Owner
Home Financials are based on the most recent Mortgage that was taken out on this home.
Original Mortgage
$450,000
Outstanding Balance
$414,731
Interest Rate
3.11%
Mortgage Type
Purchase Money Mortgage
Estimated Equity
$347,367
Purchase Details
Closed on
Dec 18, 2009
Sold by
Stracher Donald G and Stracher Rochelle L
Bought by
Vanderwerken Stephen J
Home Financials for this Owner
Home Financials are based on the most recent Mortgage that was taken out on this home.
Original Mortgage
$247,926
Interest Rate
5%
Mortgage Type
Purchase Money Mortgage
Create a Home Valuation Report for This Property
The Home Valuation Report is an in-depth analysis detailing your home's value as well as a comparison with similar homes in the area
Home Values in the Area
Average Home Value in this Area
Purchase History
| Date | Buyer | Sale Price | Title Company |
|---|---|---|---|
| Difiore Ellen | $600,000 | None Available | |
| Vanderwerken Stephen J | $252,500 | -- |
Source: Public Records
Mortgage History
| Date | Status | Borrower | Loan Amount |
|---|---|---|---|
| Open | Difiore Ellen | $450,000 | |
| Previous Owner | Vanderwerken Stephen J | $240,000 | |
| Previous Owner | Vanderwerken Stephen J | $247,926 | |
| Previous Owner | Vanderwerken Stephen J | $8,500 |
Source: Public Records
Tax History Compared to Growth
Tax History
| Year | Tax Paid | Tax Assessment Tax Assessment Total Assessment is a certain percentage of the fair market value that is determined by local assessors to be the total taxable value of land and additions on the property. | Land | Improvement |
|---|---|---|---|---|
| 2025 | $5,660 | $582,300 | $217,700 | $364,600 |
| 2024 | $5,565 | $571,900 | $207,300 | $364,600 |
| 2023 | $5,597 | $528,500 | $185,100 | $343,400 |
| 2022 | $4,638 | $395,400 | $121,000 | $274,400 |
| 2021 | $4,063 | $326,600 | $110,000 | $216,600 |
| 2020 | $3,988 | $323,400 | $110,000 | $213,400 |
| 2019 | $4,002 | $315,400 | $110,000 | $205,400 |
| 2018 | $3,767 | $291,300 | $110,000 | $181,300 |
| 2017 | $3,605 | $273,300 | $104,800 | $168,500 |
| 2016 | $3,563 | $261,800 | $109,400 | $152,400 |
| 2015 | $3,508 | $257,000 | $109,400 | $147,600 |
Source: Public Records
Map
Nearby Homes
- 20 Haskell St
- 26 Marina Dr
- 9 Rocky Pasture Rd
- 86 E Main St
- 97 E Main St
- 100 E Main St
- 8 Barn Ln
- 29 Harrison Ave
- 28 Old Nugent Farm Rd
- 20 Calder St
- 30 Chapel St Unit B
- 52 Taylor St
- 22 Taylor St Unit 1
- 197 E Main St
- 197 E Main St Unit 2
- 197 E Main St Unit 1 & 2
- 160 Prospect St Unit 3
- 4 Mount Vernon St
- 36 Links Rd
- 73 Rocky Neck Ave Unit 2